Spring Wheat / NDVI
The Spring Wheat / NDVI index is a 10-day interval index designed to monitor spring wheat productivity and estimate potential harvests using the Normalized Difference Vegetation Index (NDVI). The index covers areas observed for Total Above Ground Productivity (TAGP) of spring wheat. Data is presented on grids sized 0.1° x 0.1° (latitude and longitude), with all values representing the mean NDVI values. Aggregated indices for selected areas are provided on designated pages, with URLs listed at the bottom of this page.
Grids
All grids are based on TAGP data retrieved from Copernicus, spanning the northern and southern hemispheres. Over 30,000 grids have been generated using TAGP observations of spring wheat since July 2020. Each grid measures 0.1° x 0.1°, approximately equivalent to 12.5 km x 12.5 km. Within each TAGP grid, approximately 1,000 NDVI grids are included, each measuring 300 m x 300 m. The NDVI data is also sourced from Copernicus.
Index
The Spring Wheat / NDVI index values are averages of NDVI within a given TAGP grid at specific times. Each mean NDVI value is calculated based on TAGP grids observed from July 2020 to October 2024, and the time-series data from July 2020 is provided. This average NDVI value is considered an indicator of total above-ground productivity for spring wheat.
As illustrated in the figure 1 below, during the growing stage of spring wheat, the mean value of NDVI tends to increase and correlate to total above-ground productivity. This scatter plot is developed by the process tha TAGP and NDVI are grouped by latitudes and longitude and the values of TAGP are converted into logged values (natural logarithm). The definition of the growing stage in the grouped area is the period that the TAGP value is less than the fourth value from its maximum. Although the difference of correlation types should be more in consideration, the average NDVI value serves as a straightforward and accessible indicator of spring wheat productivity.

Indices for Selected Areas
Indices for selected areas are provided on specific pages, such as:
On each page, the value displayed in the top-left (or top) position represents the aggregated index for the entire area shown on the page. This value is calculated as the mean NDVI of all NDVI grids within the area, rather than the mean of individual index values for sub-areas.

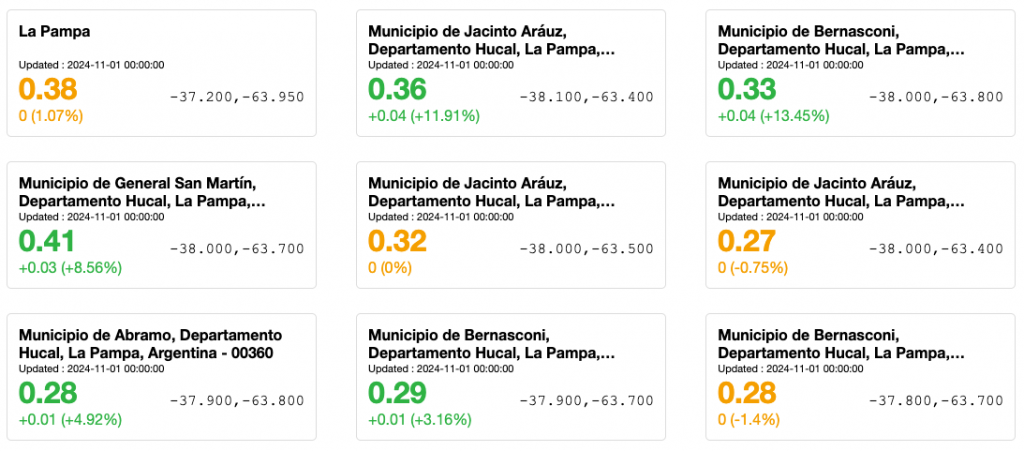
For instance, on the La Pampa, Argentina page, the aggregated mean for all 86 grids is shown as 0.38 (as of 1st Nov, 2024). This value is based on over 86,000 NDVI grid points in La Pampa, rather than the 86 sub-area indices listed individually (e.g., 0.36, 0.33, 0.41).
Note that the index data on selected area are free to use with the attribution or link to this page.
Data Download
The index data can be downloaded in CSV, PNG, and SVG formats from the area pages.
Citation
When citing or utilizing this index data, please include the following attribution or html code:
Attribution
Otani & Co., Inc. Spring Wheat / NDVI Index. https://otani.co/docs/crop-spring-wheat-ndvi/HTML
<a target="_blank" href="https://otani.co/docs/crop-spring-wheat-ndvi/">Spring Wheat / NDVI Index.</a>Data Source
“European Union’s Copernicus Land Monitoring Service information; NDVI and Spring Wheat Total Above Ground Producton”
For additional information, customization, or applications of the data, please contact us using the form on this page.