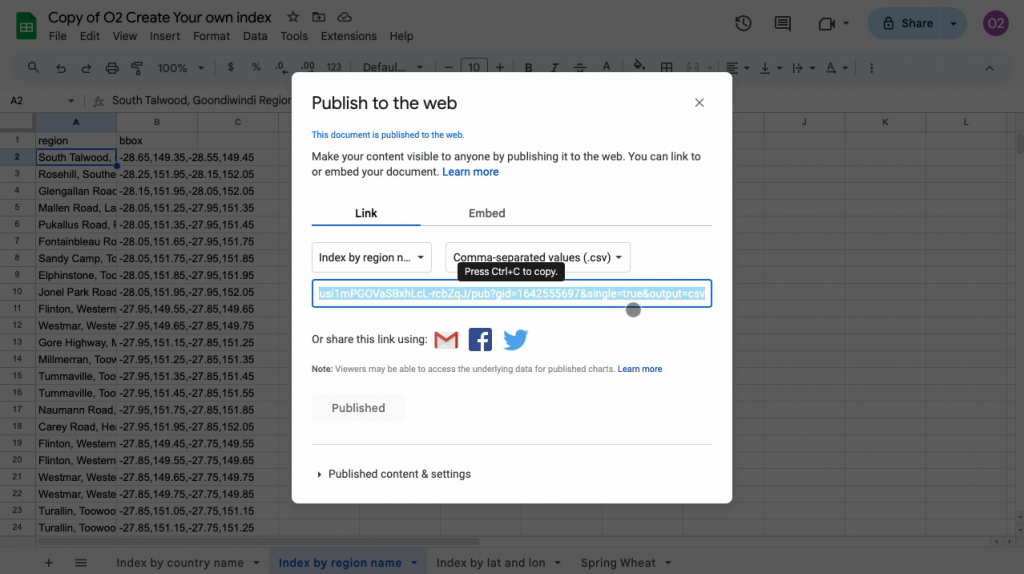
Monitoring approach with satellite data
O2 Grain Pulse uses advanced satellite data, including Copernicus satellites, to provide a comprehensive picture of agricultural productivity.
A New Approach to Crop Monitoring
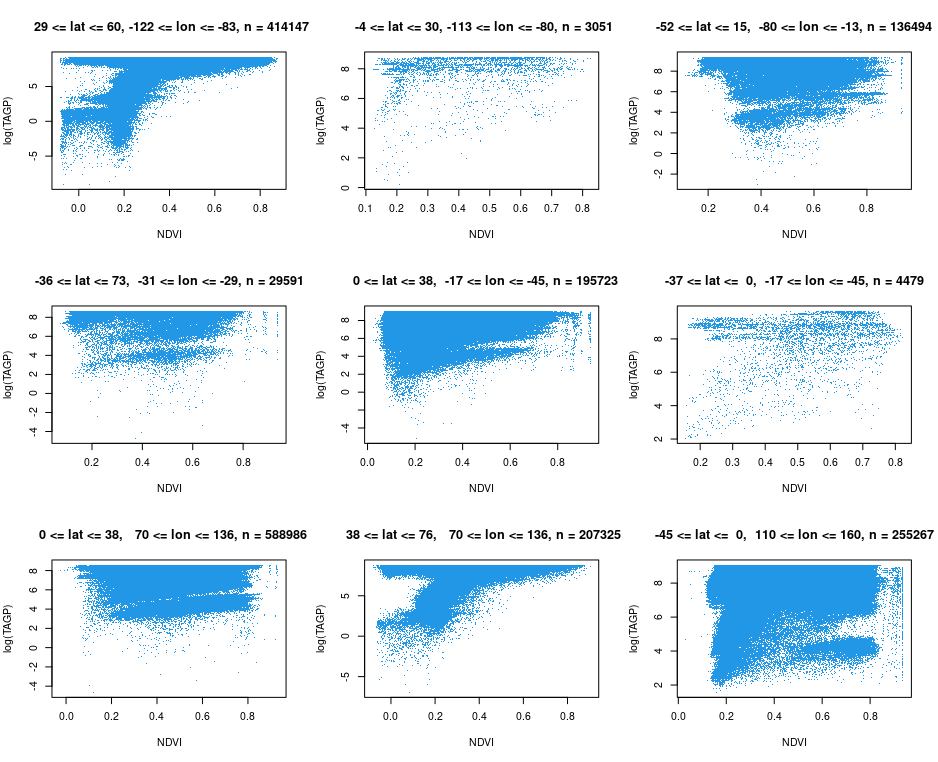
At the heart of O2 Pulse lies its focus on Total Above Ground Productivity (TAGP), a metric representing the total biomass of a crop’s above-ground components. TAGP, measured in kilograms or tons per hectare, serves as a reliable indicator of crop growth and yield potential.
What sets O2 Pulse apart is its ability to deliver this information at both global and localized scales. The platform features grids at two resolutions: 12.5 km x 12.5 km and 300 m x 300 m. This dual resolution enables users to analyze productivity trends on a regional or even field-specific level.
Practical Features for Real-World Applications
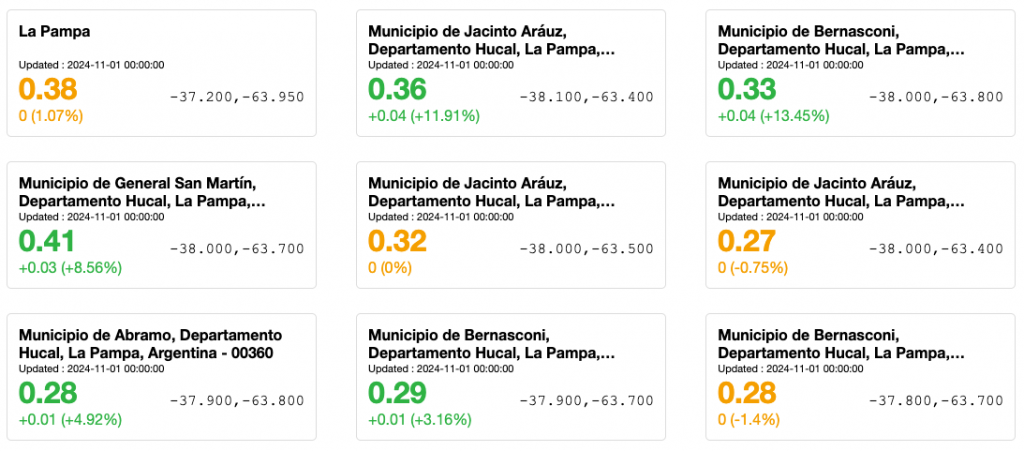
O2 Pulse provides users with a range of actionable data points. For grids measuring 300 m x 300 m, the platform not only offers TAGP estimates but also includes:
- Field area measurements
- Predicted harvest quantities
- Estimated market prices for wheat and flour
Data is updated daily, ensuring that users have access to the most current information. This capability makes the platform a valuable resource for tasks such as forecasting commodity prices, analyzing stock market trends, and evaluating the performance of companies involved in milling, food production, or dining.
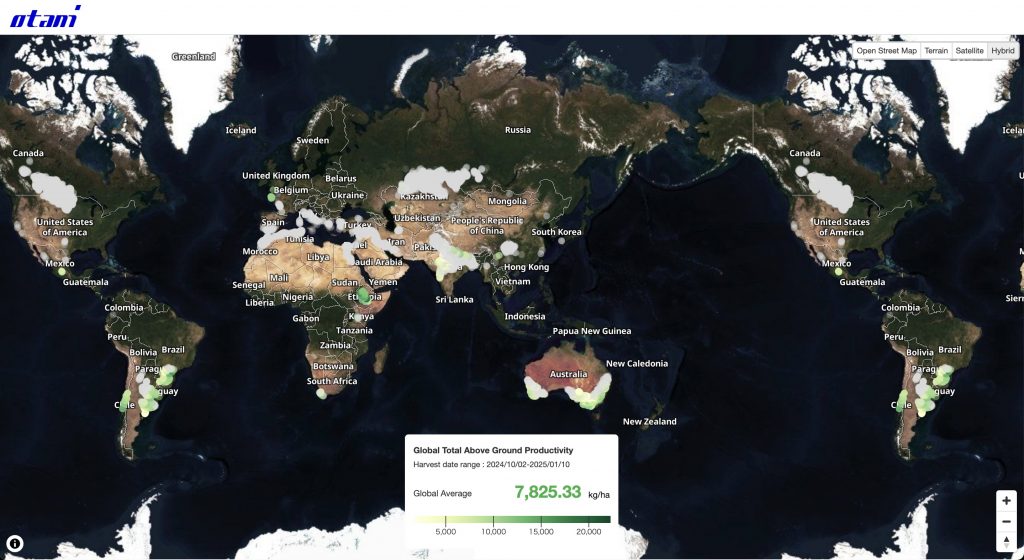
Open Access and Global Coverage
One of the most striking aspects of O2 Pulse is its accessibility. The service is offered free of charge, covering approximately 30,000 grids at the 12.5 km resolution and 30 million grids at the 300 m resolution. With such extensive global coverage, users can compare productivity across regions and even cross borders with confidence, thanks to the platform’s consistent calculation methodology.
Looking Ahead: Generative AI and Beyond
Otani & Co. is also exploring ways to enhance the platform with cutting-edge technologies. Plans include integrating generative AI tools that could generate detailed reports from imported datasets and satellite imagery. Such enhancements aim to further streamline decision-making processes for industry professionals.
Empowering Decision-Makers
O2 Pulse’s comprehensive and user-friendly approach positions it as a game-changer for agricultural analysis. By providing reliable, up-to-date data and powerful analytical tools, the platform empowers users to make informed decisions in an increasingly complex global market.