Exchange-Traded Funds (ETFs) have become an increasingly popular investment vehicle in global financial markets, allowing investors to gain exposure to a wide range of asset classes. Among these, commodities such as wheat have attracted attention as an investment opportunity, especially for those looking to diversify their portfolios or hedge against inflation and market volatility. This article provides an overview of wheat ETFs, focusing on their structure, benefits, and the factors influencing their performance.
What Are Wheat ETFs?
Wheat ETFs are exchange-traded funds that track the price performance of wheat futures or the agricultural sector as a whole, including wheat production. These ETFs allow investors to gain exposure to the wheat market without directly purchasing wheat contracts or engaging in physical commodity trading. By investing in a wheat ETF, investors can benefit from fluctuations in wheat prices, driven by factors like weather conditions, global supply and demand, and geopolitical events.
Wheat ETFs typically invest in wheat futures contracts, which are standardized agreements to buy or sell wheat at a specified price at a future date. These contracts are traded on commodities exchanges, such as the Chicago Board of Trade (CBOT). The performance of wheat ETFs is tied to the movement of these contracts, reflecting the price of wheat as it fluctuates in the market.
Types of Wheat ETFs
Wheat Futures ETFs: These ETFs primarily invest in wheat futures contracts, aiming to track the performance of wheat prices. The most common approach is to invest in short-term futures contracts, but some ETFs may hold longer-dated contracts. The primary benefit of these ETFs is their direct exposure to the price of wheat.
Agriculture ETFs with Wheat Exposure: Some ETFs track a broader basket of agricultural commodities, including wheat. These funds may invest in a variety of agricultural futures contracts, including those for corn, soybeans, and other crops. While they offer exposure to wheat, the performance of these ETFs is also influenced by the prices of other agricultural products.
Benefits of Wheat ETFs
Diversification: Wheat ETFs allow investors to diversify their portfolios by adding exposure to agricultural commodities. This can reduce overall portfolio risk, as the performance of wheat is often independent of traditional financial markets like stocks and bonds.
Hedge Against Inflation: Wheat, like other commodities, is often considered a hedge against inflation. As the cost of living rises and fiat currencies lose value, the price of commodities like wheat tends to increase. Investors can use wheat ETFs to protect their portfolios from the eroding effects of inflation.
Accessibility: Wheat ETFs provide an accessible way for retail investors to gain exposure to the wheat market. Investing in wheat futures contracts directly requires significant capital and expertise. ETFs offer a more cost-effective and simpler way to invest in wheat.
Liquidity: Since ETFs are traded on stock exchanges, they provide liquidity that allows investors to buy and sell shares easily. This is especially important for investors looking to enter or exit positions in the wheat market quickly.
Lower Costs: Compared to trading wheat futures directly, investing in an ETF typically involves lower transaction costs. Futures contracts often require margin deposits, which can be a barrier for many retail investors. ETFs eliminate the need for margin accounts, making them more accessible.
Factors Affecting Wheat ETFs
The performance of wheat ETFs is influenced by several key factors that affect the wheat market:
Weather Conditions: Weather plays a critical role in determining the global supply of wheat. Droughts, floods, or extreme temperatures can significantly affect wheat yields, causing supply shortages and driving up prices. These weather events can cause sharp price movements in wheat futures, directly impacting the performance of wheat ETFs.
Global Supply and Demand: Wheat is a staple crop with a broad base of global demand, particularly in countries like China, India, and Russia. Any disruptions to global supply chains, such as trade restrictions or crop failures, can impact wheat prices. Similarly, demand factors, such as population growth and dietary changes, can influence the price direction.
Geopolitical Events: Political instability in major wheat-producing regions, such as Russia, Ukraine, and the United States, can lead to market uncertainty and price fluctuations. For example, the conflict in Ukraine significantly impacted global wheat supplies in recent years, causing wheat prices to spike and influencing wheat ETFs.
Government Policies: Subsidies, tariffs, and other agricultural policies enacted by governments can have a direct impact on wheat production and prices. For instance, trade agreements or export restrictions can reduce or increase global wheat supplies, influencing prices and, by extension, wheat ETFs.
Currency Exchange Rates: Since wheat is a globally traded commodity, the value of major currencies, such as the U.S. dollar, can influence wheat prices. A stronger dollar can make wheat more expensive for buyers in other currencies, potentially reducing demand and affecting wheat ETF performance.
Inflation and Interest Rates: Inflationary pressures and changes in interest rates can also impact the agricultural markets, including wheat. Rising inflation often leads to higher commodity prices, including wheat, benefiting wheat ETFs. Conversely, higher interest rates may reduce demand for commodities as borrowing costs increase.
Risks of Wheat ETFs
While wheat ETFs offer various advantages, they also carry specific risks:
Price Volatility: The wheat market is highly volatile, with prices susceptible to fluctuations due to weather, supply disruptions, and political instability. This volatility can lead to significant price swings in wheat ETFs, which can result in substantial gains or losses for investors.
Contango and Backwardation: Wheat futures markets can experience periods of contango (when future contracts are more expensive than the spot price) or backwardation (when future contracts are cheaper than the spot price). These conditions can impact the performance of wheat ETFs, especially those that roll over futures contracts regularly.
Exposure to Other Commodities: Agriculture ETFs that include wheat as part of a broader portfolio of commodities may be less sensitive to wheat price movements if other commodities in the portfolio perform poorly or strongly.
Conclusion
Wheat ETFs provide a unique and accessible way for investors to gain exposure to the wheat market without directly participating in futures contracts or physical commodity trading. These funds offer diversification, inflation hedging, and liquidity, making them an attractive option for investors interested in agricultural markets. However, wheat ETFs are subject to various risks, including price volatility, geopolitical events, and supply and demand fluctuations. As with any investment, it is essential for investors to carefully evaluate their risk tolerance and consider how wheat ETFs fit into their broader investment strategy.
Wheat, as one of the most essential global staple crops, plays a critical role in both the agricultural sector and the global financial markets. The production and trading of crops significantly influence and are influenced by financial market dynamics. From the price fluctuations on commodity exchanges to the impact on economic policies and global trade, the relationship between wheat production and the financial market is complex and multifaceted. This article provides an overview of this relationship, examining how wheat production affects the financial market and how financial markets, in turn, influence wheat production.
1. Wheat Production and Price Fluctuations
The financial market, particularly the commodity markets, plays a central role in determining the price of crops. Futures contracts for wheat are traded on exchanges like the Chicago Board of Trade (CBOT) and the European Union’s Euronext, where the prices are driven by various factors related to wheat production.
Supply and Demand Factors
The balance of supply and demand is a primary factor that determines wheat prices. Factors such as weather conditions, crop yields, technological advancements in farming, and global production levels all influence supply. Conversely, demand factors include global consumption trends, population growth, and changes in diets, particularly in developing countries where crop consumption may be increasing.
For instance, if wheat production in key exporting regions like the United States, Russia, or the European Union is reduced due to adverse weather conditions, prices will likely rise due to the decreased availability of the commodity. Similarly, an increase in demand, perhaps due to expanding populations or more demand from the biofuel industry, can also drive prices higher.
Volatility and Speculation
Financial markets are often subject to volatility, and crop prices are no exception. Speculators in the futures markets often react to perceived risks in wheat production, such as potential droughts, floods, or disease outbreaks that might impact yields. These speculations can result in sudden price fluctuations that can affect not only the wheat industry but also broader agricultural markets and even the global economy.
The volatility of wheat prices also impacts the agricultural sector directly. Farmers may face increased uncertainty regarding profitability, which can affect their decisions to plant wheat or switch to other crops. Moreover, the financial market provides tools like hedging through futures contracts, which allow farmers and other stakeholders to manage these price risks.
2. Wheat Production, Global Trade, and Financial Flows
Wheat is traded globally, and its production and consumption are spread across multiple continents. The dynamics of wheat trade are influenced by financial markets, which facilitate the exchange of wheat across borders. As an agricultural commodity, wheat is subject to fluctuations in global financial flows, which are impacted by changes in interest rates, exchange rates, and economic policies.
Global Trade and Currency Exchange
Countries that are major wheat producers, such as the United States, Canada, Russia, and Australia, not only influence the price of wheat through their production levels but also by their currency exchange rates. A stronger currency in a major producing country, for example, can make wheat exports more expensive and reduce demand from foreign buyers. Conversely, a weaker currency can make exports cheaper, boosting demand for wheat on the global market.
Impact of Financial Crises and Policy Changes
Global financial crises can have a significant impact on wheat production and trade. Economic downturns can lead to decreased demand for wheat, particularly in developing countries where wheat is a staple food. Conversely, during times of economic growth, wheat demand can increase, raising prices and stimulating production. Changes in agricultural policies, including subsidies, tariffs, and export restrictions, are also influenced by the financial landscape and can have a profound impact on wheat production and trade flows.
3. The Role of Financial Instruments in Wheat Production
Financial markets offer various instruments to manage the risks associated with wheat production. These instruments help farmers, traders, and food producers mitigate the uncertainties they face regarding price movements and weather-related risks.
Hedging through Futures and Options
Farmers and agribusinesses use futures contracts to hedge against price fluctuations in the wheat market. By locking in a price for their wheat in advance, they can ensure profitability even if market prices decline. Similarly, options allow producers and traders to buy or sell wheat at predetermined prices, offering further protection against price volatility.
Investment in Agricultural Funds and ETFs
Agricultural funds and exchange-traded funds (ETFs) focused on wheat allow investors to gain exposure to the wheat market without directly investing in the commodity. These financial products track the performance of wheat futures, providing a way for investors to profit from price movements in the wheat market.
4. The Interplay Between Climate, Financial Markets, and Wheat Production
Wheat production is highly sensitive to climate change, with droughts, floods, and temperature extremes affecting yields. The financial markets often respond to these climatic risks by adjusting prices in anticipation of potential disruptions to wheat production.
Climate Risk and Financial Market Response
When weather patterns suggest potential disruptions in wheat production—such as a heatwave in a major producing country or an unusually wet season—prices can spike in anticipation of reduced supply. Financial markets then adjust in real-time, with investors and traders reacting to the potential for shortages. In some cases, weather-related disruptions can lead to more significant price volatility, which in turn affects the global economy, as wheat is a critical component in many food products.
Additionally, climate change and its effects on wheat production may lead to long-term adjustments in agricultural finance, with greater investment in technologies designed to mitigate the impacts of extreme weather and enhance resilience in wheat production.
5. Wheat Production and Food Security
Wheat is a key component in global food security, particularly in regions with high dependence on wheat as a primary food source. Financial markets play a pivotal role in stabilizing prices and ensuring that wheat remains accessible to consumers worldwide. However, price volatility and supply chain disruptions can exacerbate food insecurity, particularly in low-income regions that rely on wheat imports.
Financial institutions and development organizations may provide funding or policy support to help countries increase their domestic wheat production or develop systems to better manage supply chains. In this context, financial markets influence food security by helping stabilize wheat prices, facilitating international trade, and enabling investment in agricultural infrastructure.
Conclusion
The relationship between wheat production and the financial market is dynamic and complex. Wheat prices are determined by the interplay of production factors, global trade, currency fluctuations, and speculative activity in financial markets. At the same time, financial instruments, such as futures contracts and ETFs, provide tools for hedging against price risks and allow for investment in agricultural assets. As climate change continues to affect wheat production, the role of financial markets in providing risk management and facilitating investment in resilience will become increasingly important. Understanding this relationship is crucial for stakeholders in the wheat industry, from farmers to traders to policymakers, as they navigate the challenges and opportunities presented by global wheat production and financial markets.
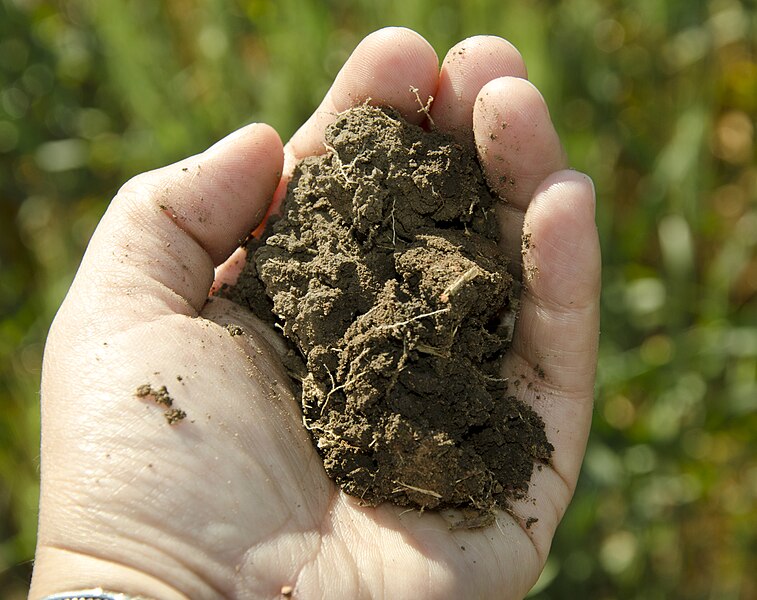
Wheat is one of the most widely cultivated crops in the world, and its successful cultivation is heavily influenced by the type and quality of the soil. Soil plays a critical role in wheat growth by providing essential nutrients, water, and structure for healthy root development. The soil type, texture, pH, fertility, and drainage conditions all impact wheat yields and the overall quality of the crop. This article provides an overview of the key factors that influence soil suitability for wheat production.
1. Soil Texture and Structure
Soil texture refers to the proportion of sand, silt, and clay particles in the soil, which affects its water retention, nutrient-holding capacity, and ease of tillage. For optimal wheat growth, soils with a loamy texture are ideal, as they provide a balance of water-holding capacity and good drainage. Loamy soils are rich in essential nutrients and offer sufficient aeration for roots, which is important for healthy wheat growth.
Sandy Soils
Sandy soils have a high proportion of sand particles, which results in good drainage but poor water retention. While these soils may not retain enough moisture during dry periods, they are easier to work with and warm up faster in the spring. They are often used for wheat production in regions with moderate to low rainfall, where irrigation is available to supplement water needs.
Clay Soils
Clay soils have a higher proportion of fine particles, which leads to better water retention but slower drainage. While clay soils can provide a stable environment for wheat during dry spells, they are prone to waterlogging and poor aeration if not properly managed. Proper tillage and drainage are essential in clay soils to prevent root rot and other diseases that can negatively affect wheat yields.
Loamy Soils
Loam soils, with a balanced mix of sand, silt, and clay, are generally considered the best for wheat production. They provide adequate drainage while maintaining sufficient moisture retention and are nutrient-rich, promoting healthy growth. Loam soils are ideal for most wheat-growing regions as they offer a good balance between water retention and aeration.
2. Soil pH
The pH level of soil indicates its acidity or alkalinity and has a significant impact on the availability of nutrients to plants. Wheat grows best in soils with a pH range of 6.0 to 7.5, which is considered neutral to slightly alkaline. Soils that are too acidic (below 6.0) can limit the availability of essential nutrients like phosphorus, calcium, and magnesium, while highly alkaline soils (above 7.5) can lead to micronutrient deficiencies.
Farmers may need to adjust soil pH levels using lime to raise pH in acidic soils or sulfur to lower pH in alkaline soils, depending on the local conditions.
3. Soil Fertility
Soil fertility is the ability of the soil to provide essential nutrients for plant growth. Wheat requires a variety of nutrients, including nitrogen, phosphorus, potassium, and trace elements such as zinc, iron, and manganese. Nitrogen, in particular, is critical for wheat development, as it promotes vigorous vegetative growth and ensures a high yield.
Fertilization
In many wheat-growing regions, soils may not provide sufficient levels of nutrients for optimal crop production, necessitating the use of fertilizers. Nitrogen fertilizers are commonly applied to wheat crops to support growth during the early stages, while phosphorus and potassium are often added to promote root development and improve overall plant health.
Organic Matter
Incorporating organic matter such as compost or cover crops into the soil can significantly improve its fertility by increasing nutrient availability, enhancing soil structure, and promoting microbial activity. Organic matter helps maintain soil moisture and supports a healthy ecosystem for wheat growth.
4. Soil Drainage
Proper soil drainage is essential for preventing waterlogging, which can lead to root diseases, poor aeration, and reduced yields. Soils with good drainage allow excess water to escape while retaining enough moisture for the wheat plants to thrive. In regions with heavy rainfall, farmers often implement drainage systems, such as tile drainage or surface drains, to prevent water accumulation and ensure proper root development.
In dry regions, proper soil moisture retention is equally important. Soils that are too sandy may require irrigation to maintain adequate moisture levels for wheat growth, while soils with excessive clay content may need to be amended with organic matter or sand to improve water drainage.
5. Soil Conservation Practices
Soil erosion is a major concern in wheat farming, particularly in areas where heavy rainfall, strong winds, or improper farming practices may lead to the loss of topsoil. Soil conservation practices, such as no-till farming, crop rotation, and the use of cover crops, help preserve soil quality, prevent erosion, and promote sustainable wheat production.
Soil for Wheat Production
Soil is a fundamental factor that influences the success of wheat production. The ideal soil for wheat farming depends on a balance of texture, pH, fertility, and drainage conditions. Loamy soils with a neutral pH and good fertility are generally the best for wheat, although farmers can adapt to various soil types through proper management practices. By understanding the specific soil requirements for wheat and adopting appropriate techniques, farmers can optimize yields, reduce environmental impacts, and ensure the long-term sustainability of wheat production.
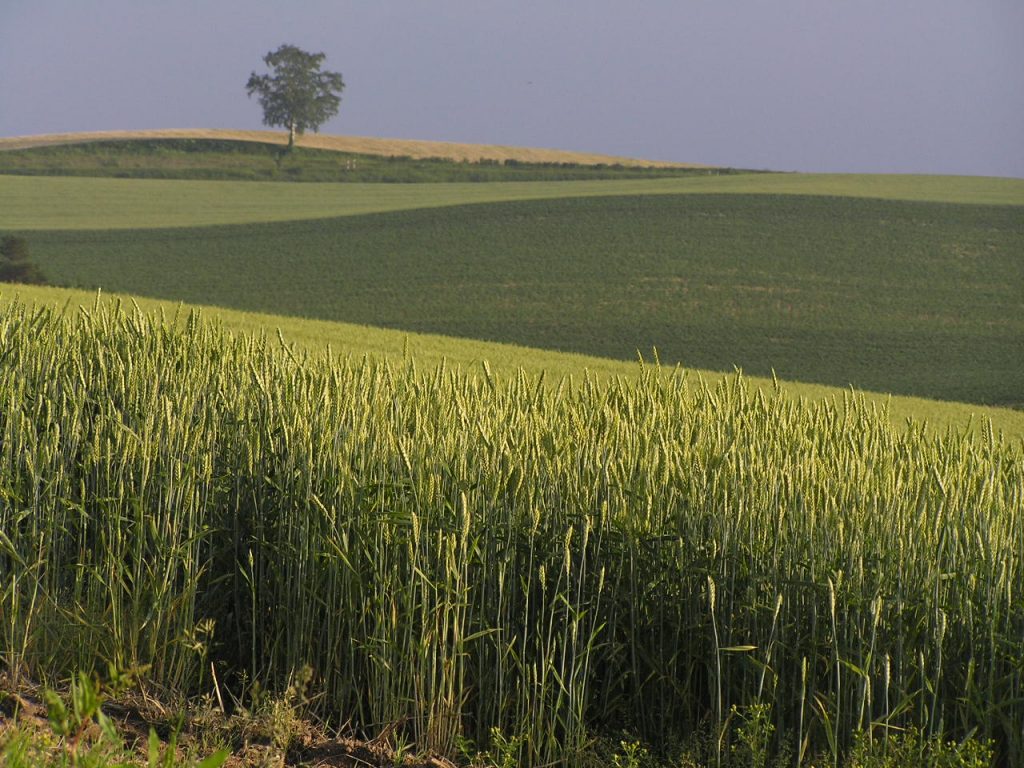
Wheat is a staple crop in Japan, playing an important role in the country’s agricultural production. While Japan is better known for its rice production, wheat cultivation is significant due to the demand for wheat in food products such as bread, noodles, and other processed foods. The wheat varieties grown in Japan differ from those cultivated in other countries, with specific types being chosen based on their suitability for Japan’s climate and the types of food products being produced. This article provides an overview of the primary wheat types grown in Japan, their characteristics, and the regions where they are cultivated.
1. Soft White Winter (SWW)
Characteristics
Soft White Winter (SWW) is the most widely cultivated wheat variety in Japan. It is characterized by its low protein content and soft, white kernels. This type is commonly used to produce flour for products like udon noodles, pancakes, and pastries. SWW is ideal for soft-textured baked goods and noodle production due to its lower protein content, which results in a more delicate and tender texture.
SWW has a relatively mild flavor and is preferred for its ability to absorb water, which is important for the production of noodles and other dough-based products.
Yields
The yield of Soft White Winter in Japan varies depending on the region and weather conditions. In general, yields are moderate compared to other wheat types, with typical yields ranging from 2 to 4 tons per hectare. The yield can be influenced by factors such as temperature, soil quality, and the presence of pests and diseases.
Primary Growing Regions
Soft White Winter is primarily grown in the northern regions of Japan, particularly in Hokkaido. Hokkaido’s cooler climate and longer winters make it an ideal location for growing winter wheat. Other regions where SWW wheat is cultivated include parts of Honshu, especially in the colder areas of Tohoku and Kinki. However, Hokkaido remains the primary wheat-growing area in Japan due to its favorable growing conditions.
2. Hard Red Winter (HRW)
Characteristics
Hard Red Winter (HRW) is another wheat variety that is grown in Japan, though it is less common than Soft White Winter. HRW has a higher protein content and a firmer texture, making it suitable for bread production. The high protein content of HRW wheat makes it ideal for producing bread flour, which requires strong gluten for dough structure.
HRW is used for bread-making and other products that require more gluten strength. The wheat kernels are hard and reddish-brown, which distinguishes them from the softer, lighter kernels of SWW.
Yields
The yield of Hard Red Winter in Japan is generally lower than Soft White Winter, with typical yields ranging from 2 to 3 tons per hectare. HRW requires specific growing conditions and is more susceptible to weather extremes, such as cold temperatures during the winter months.
Primary Growing Regions
Hard Red Winter is cultivated in smaller quantities compared to SWW, and its production is generally concentrated in the colder regions of Japan. Areas in Hokkaido and parts of northern Honshu are the primary regions for HRW cultivation. However, the production volume remains limited due to the specific climate requirements and the competition with SWW.
3. Durum Wheat
Characteristics
Durum Wheat, known for its high protein content and hard texture, is another wheat variety that is cultivated in Japan, though its cultivation is more specialized. Durum wheat is primarily grown for pasta production due to its strong gluten structure, which is necessary for pasta to retain its shape during cooking. Durum wheat has a golden-yellow color and is often used to produce semolina flour.
Durum wheat is highly valued in Japan for making pasta, particularly in the production of high-quality spaghetti, macaroni, and other pasta products.
Yields
Durum wheat yields in Japan are generally lower than those of other wheat types, typically ranging from 1 to 2 tons per hectare. Durum wheat requires a warm growing season and specific soil conditions to develop its characteristic hard texture and high protein content.
Primary Growing Regions
The cultivation of Durum wheat in Japan is relatively limited compared to Soft White Winter. It is mainly grown in parts of Hokkaido, where the climate is more suitable for the cultivation of wheat types with specific needs. However, Durum wheat’s overall production remains small due to its specialized nature and the competition from other wheat types.
4. Spring Wheat (SWW, HRW)
Characteristics
Spring wheat, which includes both Soft White Spring and Hard Red Spring, is planted in the spring and harvested in late summer or early fall. While the total acreage of spring wheat in Japan is relatively small, it is still an important wheat type used for bread and noodle production. Spring wheat varieties tend to have a higher protein content than soft winter wheat varieties, making them ideal for bread-making.
Spring wheat varieties have a firmer texture than soft winter wheat, which makes them more suitable for products that require stronger gluten, such as bread and pasta.
Yields
Spring wheat yields in Japan are generally lower than those of winter wheat varieties, with typical yields ranging from 2 to 3 tons per hectare. Spring wheat is more sensitive to weather fluctuations, and its yields can be impacted by temperature and rainfall.
Primary Growing Regions
Spring wheat is grown in Japan’s cooler regions, particularly in Hokkaido. Due to the short growing season and relatively mild temperatures, Hokkaido is the most suitable area for spring wheat cultivation. Other regions of Japan, including parts of Honshu, may also grow spring wheat, but it remains a minor crop compared to winter wheat.
Wheat Types in Japan
Wheat production in Japan is primarily focused on Soft White Winter, which is well-suited for the country’s food processing industry, especially for noodles, bread, and pastries. Other wheat varieties, such as Hard Red Winter and Durum Wheat, are also grown in smaller quantities, with each serving a specific role in the production of bread and pasta products. Japan’s wheat cultivation is concentrated in the northern regions, particularly in Hokkaido, where the climate is more favorable for growing winter wheat and specialized wheat varieties. Despite the relatively small acreage compared to other countries, Japan remains a significant player in the wheat market, with domestic wheat production contributing to the country’s agricultural economy.
Canada is one of the world’s largest wheat producers and exporters, particularly known for its high-quality wheat. The country’s diverse climates and regions support the cultivation of different wheat types, each with unique characteristics and uses. This article explores the major wheat types grown in Canada, their characteristics, and the regions where they are predominantly cultivated.
1. Hard Red Spring (HRS)
Characteristics
Hard Red Spring (HRSW) is the flagship wheat variety of Canada, particularly prized for its high protein content and strong gluten quality. These characteristics make it ideal for bread and other baked goods that require good dough elasticity. HRSW kernels are red and hard, with a high protein content, which is one of the highest among wheat varieties, typically ranging from 13% to 15%. This wheat is known for its excellent milling properties and high-quality flour.
HRSW is planted in the spring and harvested in late summer. It thrives in regions with cooler growing conditions, making it well-suited to Canada’s northern climate.
Yields
The yield of Hard Red Spring in Canada typically ranges from 35 to 50 bushels per acre. Yields can vary depending on weather conditions, such as drought, rainfall, and temperature fluctuations, which can impact crop development. However, Canada’s consistent research and development in wheat breeding contribute to relatively stable yields.
Primary Growing Regions
HRSW is primarily grown in the Prairie Provinces of Canada, with the highest production in Saskatchewan, Manitoba, and Alberta. Saskatchewan is the largest producer of HRSW, accounting for the majority of the country’s wheat exports. The region’s cool growing conditions, coupled with good soil quality, create ideal conditions for the production of high-quality HRSW.
2. Hard Red Winter (HRW)
Characteristics
Hard Red Winter (HRW) is a notable variety grown in Canada, though it is less prevalent than Hard Red Spring (HRSW). It features moderate to high protein levels, making it suitable for bread-making, albeit with slightly lower protein content than HRSW. The kernels of HRW are red and softer than those of spring wheat. While HRW has strong milling properties, its production is more common in warmer climates, with Canada’s output being relatively limited in comparison.
HRW is planted in the fall and harvested in the summer, following a similar growing pattern to HRW in other regions.
Yields
In Canada, HRW typically yields between 30 and 40 bushels per acre, lower than HRSW. This variety is less widely cultivated in Canada, with production volumes trailing behind HRS and Soft Red Winter.
Primary Growing Regions
Hard Red Winter Wheat in Canada is primarily grown in areas with milder winters, such as southern Manitoba and southwestern Ontario. However, the acreage devoted to HRW wheat is significantly smaller than that for Hard Red Spring Wheat.
3. Soft Red Winter (SRW)
Characteristics
Soft Red Winter (SRW) is primarily grown in regions with milder climates, and while it is not as commonly grown in Canada as other wheat types, it still plays a role in the country’s wheat production. SRW wheat is characterized by its low protein content and soft kernels, which make it suitable for products such as cakes, pastries, and crackers. Its flour produces a lighter, softer texture compared to higher-protein wheat types. SRW wheat is typically grown in regions where mild winters and moderate rainfall are common.
Yields
The yield of Soft Red Winter in Canada is relatively high, ranging from 50 to 70 bushels per acre in optimal conditions. However, the overall acreage of SRW grown in Canada is smaller compared to other varieties such as HRSW and HRW.
Primary Growing Regions
In Canada, Soft Red Winter is mainly grown in southern Ontario, where the climate is more temperate and suitable for the growth of this wheat variety. However, its production is minimal compared to other wheat types, especially in the Prairie Provinces, where HRSW dominates.
4. Durum Wheat
Characteristics
Durum Wheat is a specialty wheat type primarily grown for pasta production. Known for its very hard texture and high protein content, Durum wheat is used to produce semolina flour, which is essential for pasta. Durum wheat kernels are large, golden-yellow in color, and contain gluten, which helps pasta maintain its shape and texture when cooked. This variety has a distinctive yellowish hue, making it ideal for producing pasta with a golden appearance.
Durum wheat requires a hot and dry growing season, making it well-suited for specific regions of Canada.
Yields
The yield of Durum Wheat in Canada is typically lower than other wheat types, averaging 20 to 30 bushels per acre. While Durum wheat is less commonly grown than Hard Red Spring Wheat, its high value in pasta production makes it economically important despite its lower yield.
Primary Growing Regions
Durum wheat is primarily grown in the southern parts of the Prairie Provinces, particularly in Saskatchewan. Saskatchewan’s dry climate and hot growing season are ideal for Durum wheat cultivation. While Durum wheat production is relatively small in comparison to HRSW, Canada is one of the world’s leading exporters of Durum wheat, particularly to countries like Italy, where pasta production is a major industry.
Wheat Types in Canada
Canada’s wheat production is diverse, with the country growing several wheat types, each suited to different climates and uses. Hard Red Spring Wheat is the dominant wheat variety, known for its high protein and gluten content, while Durum wheat, used for pasta production, holds a smaller but significant role in the agricultural economy. Other wheat types, such as Hard Red Winter Wheat and Soft Red Winter Wheat, are grown in specific regions, though they make up a smaller portion of Canada’s total wheat output. The varied climate conditions across Canada’s Prairie Provinces, along with ongoing research and innovation in farming practices, enable the production of high-quality wheat that plays an important role in global markets.
The United States ranks among the world’s largest wheat producers, with wheat serving as a cornerstone of its agricultural economy. The nation cultivates several distinct wheat varieties, each adapted to specific climates and applications. These wheat types differ in traits such as protein content, gluten strength, and kernel hardness. This article delves into the primary wheat varieties grown in the U.S., their typical yields, and the regions where they are most commonly produced.
1. Hard Red Winter (HRW)
Characteristics
Hard Red Winter (HRW) is the most commonly cultivated variety of wheat in the United States. Renowned for its high protein levels and robust gluten, it is perfect for baking bread. The grains of HRW are firm and reddish-brown in color. This wheat variety is especially appreciated for its excellent milling characteristics, yielding flour with strong baking performance.
HRW is typically planted in the fall and harvested in late spring or early summer, thriving in regions with cold winters and mild to warm summers.
Yields
The yield of Hard Red Winter Wheat in the U.S. typically ranges from 30 to 50 bushels per acre, although it can vary significantly based on weather conditions and farming practices. Regions experiencing drought or unusual weather patterns can see reduced yields.
Primary Growing Regions
HRW wheat is primarily grown in the Great Plains, particularly in Kansas, Oklahoma, and Texas. These states provide the necessary cold winters for successful wheat dormancy and mild growing seasons. The HRW wheat belt also extends into Nebraska, Colorado, and Wyoming.
2. Hard Red Spring (HRS)
Characteristics
Hard Red Spring (HRS) is another widely grown variety in the United States, valued for its elevated protein levels and strong gluten, which make it ideal for bread and other baked goods. Its kernels are hard, red, and protein-rich. With a slightly higher protein content than HRW, HRS is often the top choice for producing premium bread flour.
HRS is typically planted in the spring and harvested in late summer, making it a key wheat type for northern regions with cooler climates.
Yields
The yield of Hard Red Spring Wheat is generally around 30 to 50 bushels per acre. Like HRW, yields can be influenced by environmental factors, with regions that experience drought conditions seeing reduced output.
Primary Growing Regions
HRS wheat is mainly grown in the northern plains, including North Dakota, South Dakota, and Minnesota. These regions offer the cool growing conditions ideal for HRS wheat production, as well as a longer growing season due to the cooler temperatures.
3. Soft Red Winter (SRW)
Characteristics
Soft Red Winter (SRW) is known for its lower protein content and softer kernel texture, making it ideal for creating cakes, pastries, crackers, and cookies. Compared to HRW, SRW has a softer consistency and a lighter color. It is commonly used to produce finer, lighter flour, perfect for soft and fluffy baked goods.
This variety is planted in the fall and harvested in early summer, flourishing in regions with mild winters and moderate rainfall.
Yields
Soft Red Winter Wheat yields typically range from 50 to 70 bushels per acre, with higher yields seen in regions with favorable growing conditions. The moderate climate in these areas allows for more consistent yields.
Primary Growing Regions
SRW is mainly grown in the Midwest and Eastern U.S., with major production areas in Illinois, Missouri, Indiana, and Ohio. These regions have the mild winters and abundant rainfall that make them ideal for SRW wheat production.
4. Soft White Wheat (SWW)
Characteristics
Soft White Wheat (SWW) resembles SRW wheat but features even softer kernels, making it ideal for pastries, cakes, and other delicate baked goods. Its low protein content contributes to creating tender and crumbly textures in finished products.
This type of wheat is sown in the fall and harvested in late spring or early summer, thriving in temperate climates.
Yields
Soft White Wheat typically yields between 60 and 80 bushels per acre, depending on factors such as location and weather conditions. Its high yield potential makes it a popular choice in specific growing regions.
Primary Growing Regions
SWW wheat is predominantly grown in the Pacific Northwest, especially in Washington, Oregon, and Idaho. These regions provide the cool, temperate climate ideal for soft wheat production.
5. Durum Wheat
Characteristics
Durum Wheat is the hardest variety of wheat, primarily cultivated for pasta production. It boasts a high protein content and a golden yellow hue, which is a defining characteristic of durum wheat flour. Its strong gluten structure ensures pasta maintains its shape and texture during cooking.
This wheat is planted in the spring and harvested in late summer or early fall, requiring a warm growing season for optimal development.
Yields
Durum Wheat typically yields around 20 to 30 bushels per acre, lower than other wheat types. Its yield depends heavily on precise growing conditions, including adequate irrigation and proper soil management.
Primary Growing Regions
Durum wheat is predominantly grown in the northern plains, with North Dakota leading production. Other states like Montana and Arizona also contribute, though the overall acreage is smaller compared to other wheat varieties.
Wheat Types in the United States
The United States grows a wide variety of wheat types, each with its own characteristics suited for different end uses, from bread-making to pasta production. Hard Red Winter Wheat, Hard Red Spring Wheat, Soft Red Winter Wheat, Soft White Wheat, and Durum Wheat all play crucial roles in the U.S. agricultural economy. The yield of these wheat types varies depending on the region, climate, and farming practices, but the U.S. remains a global leader in wheat production, with diverse growing conditions that support the cultivation of various wheat types across the country.
Manage Cookie Consent
We use technologies like cookies to store and/or access device information. We do this to improve browsing experience and to show personalized ads. Consenting to these technologies will allow us to process data such as browsing behavior or unique IDs on this site. Not consenting or withdrawing consent, may adversely affect certain features and functions.
Functional
Always active
The technical storage or access is strictly necessary for the legitimate purpose of enabling the use of a specific service explicitly requested by the subscriber or user, or for the sole purpose of carrying out the transmission of a communication over an electronic communications network.
Preferences
The technical storage or access is necessary for the legitimate purpose of storing preferences that are not requested by the subscriber or user.
Statistics
The technical storage or access that is used exclusively for statistical purposes.The technical storage or access that is used exclusively for anonymous statistical purposes. Without a subpoena, voluntary compliance on the part of your Internet Service Provider, or additional records from a third party, information stored or retrieved for this purpose alone cannot usually be used to identify you.
Marketing
The technical storage or access is required to create user profiles to send advertising, or to track the user on a website or across several websites for similar marketing purposes.