In this post, we will guide you through creating your own index to monitor regions of interest effectively. A link to youtube video is provided below.
Email registration
To get started, you need a Google account. Once you’ve created or logged into your account, visit the registration website and sign up for the index.
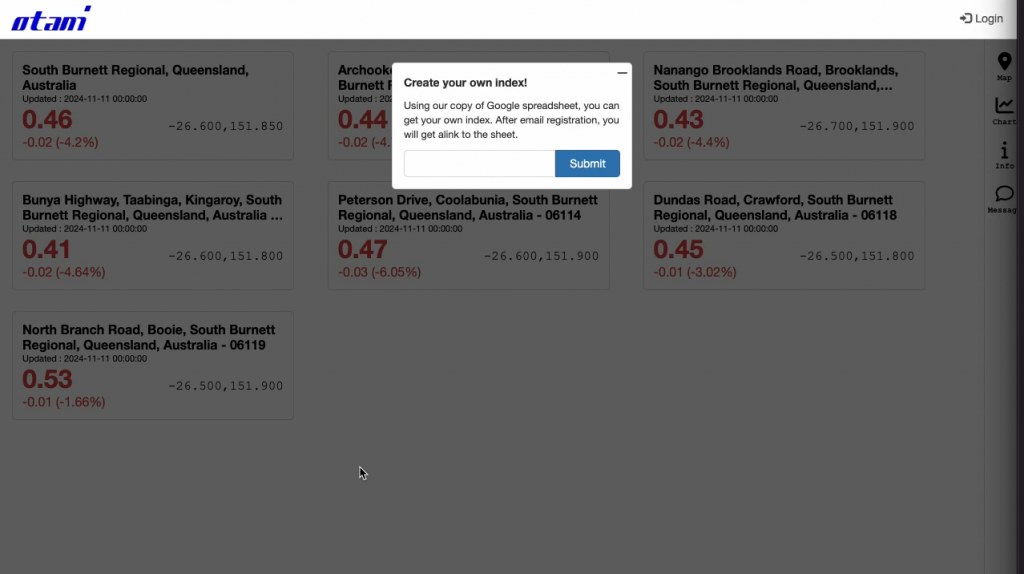
After signing up, you will receive a link to a Google Spreadsheet. This spreadsheet will serve as your configuration.
Edit a google spreadsheet
Copy the Google Spreadsheet
First, make a copy of the Google Spreadsheet. Visit the provided link and click the “Make a copy” button.
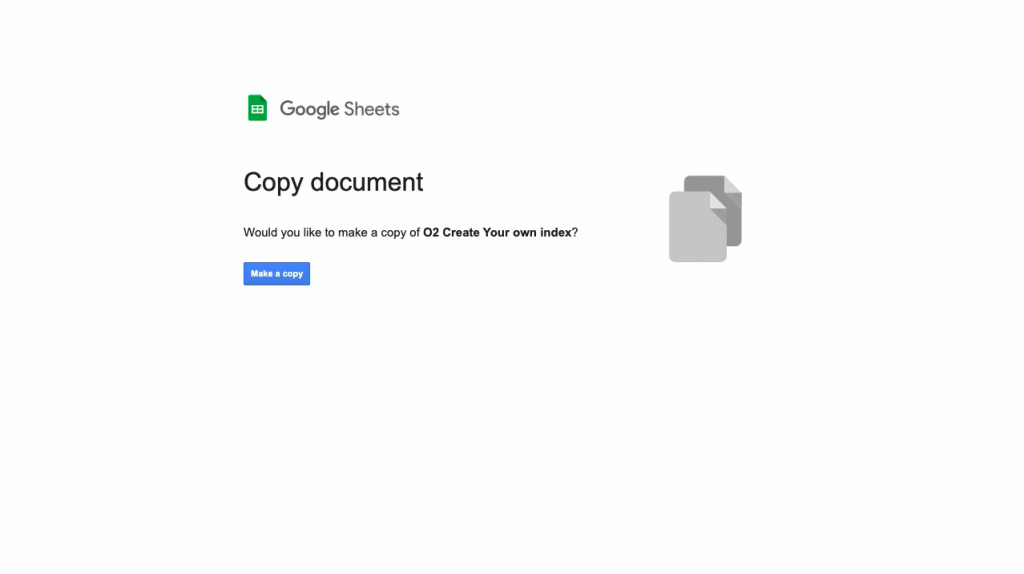
Extract Regions from the Sheet
Next, extract regions from the sheet using the QUERY function. The QUERY function enables you to filter and sort data in the spreadsheet.
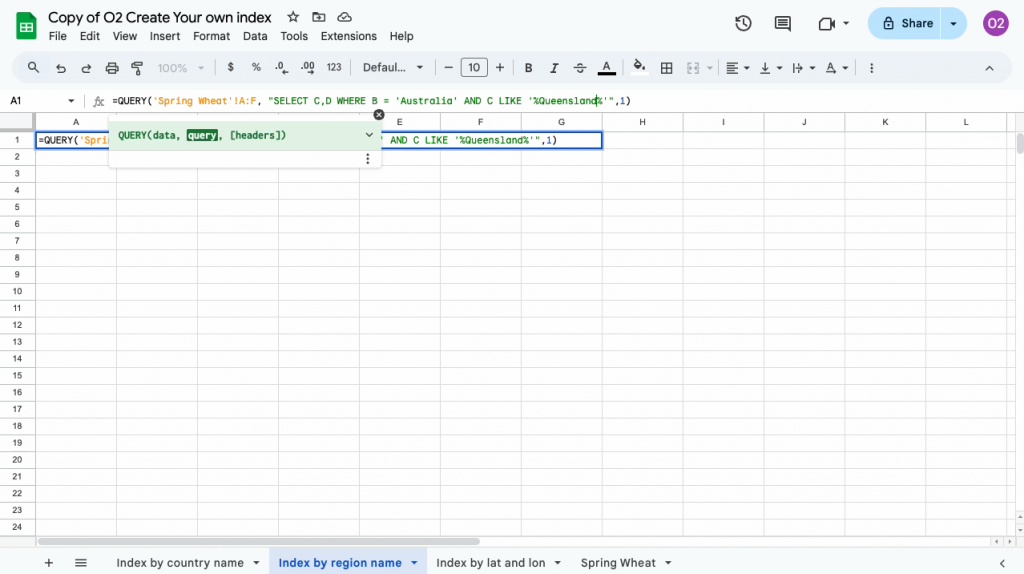
For example, a QUERY function like this:
SELECT C, D WHERE B = 'Australia' AND C LIKE '%Queensland%'might return:
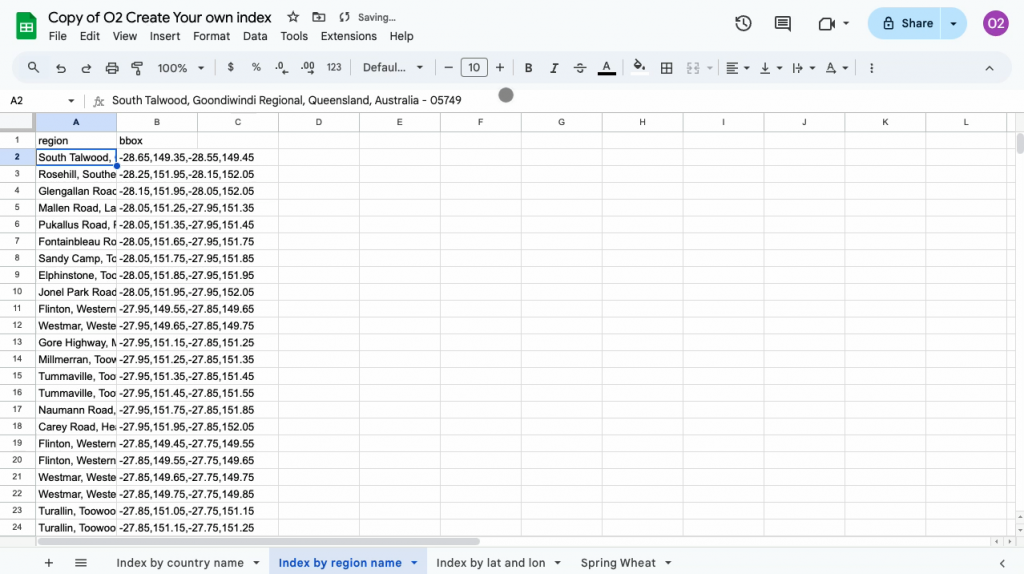
Publishing Your Spreadsheet
Publish to the Web
Publish your spreadsheet to the web in CSV format.
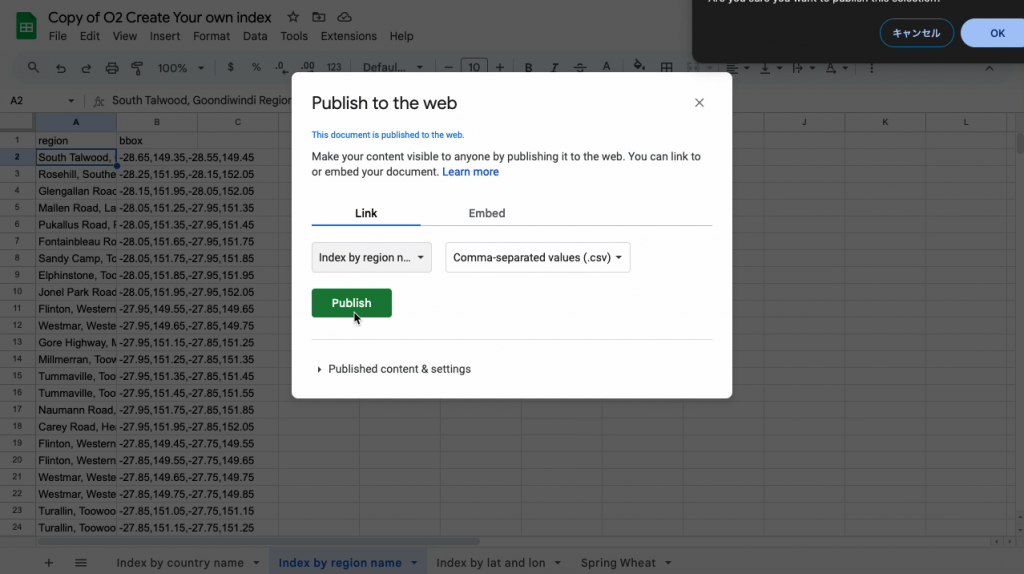
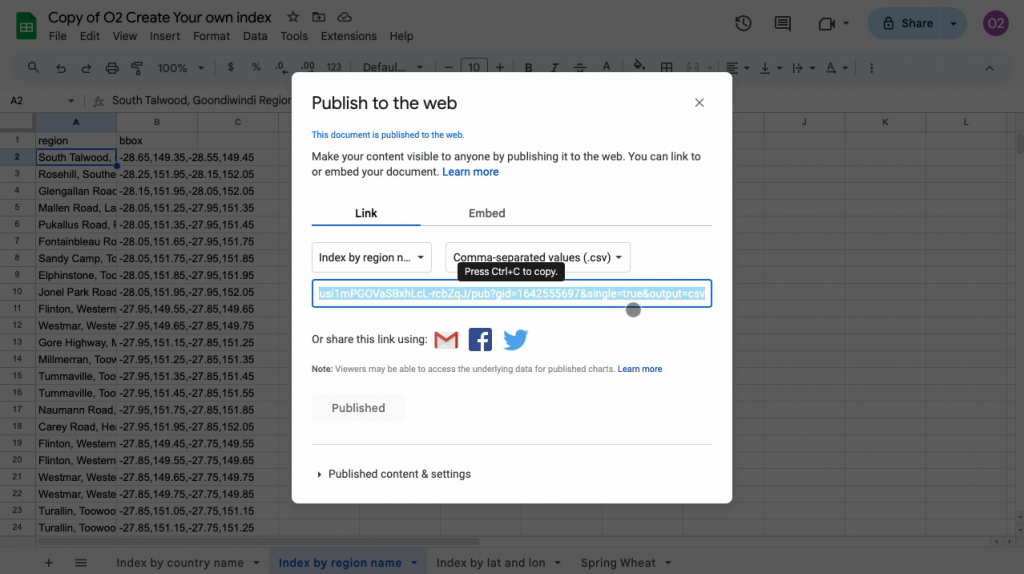
Once published, you will receive a URL like this:
https://docs.google.com/spreadsheets/d/e/2PACX-xxxxxxxx/pub?gid=16********&single=true&output=csvHere:
2PACX-xxxxxxxxis the spreadsheet ID.16********is the sheet ID.
Developing Your Own Index URL
Finally, create a URL for your custom index using the following format:
https://otani.co/crops/spring-wheat/NDVI/<your own index name>/?sid=<spreadsheet id>&gid=<sheet id>For example, if your Spring Wheat / NDVI index is named “QLD, AU“, with the spreadsheet ID 2PACX-xxxxxxxx and sheet ID 16********, the URL would be:
https://otani.co/crops/spring-wheat/NDVI/QLD, AU/?sid=2PACX-xxxxxxxx&gid=16********This allows you to access the same data with different names, such as QLD, AU and Queensland, Australia.
Conclusion
That’s it! You’ve successfully built your own index using a Google Spreadsheet. We hope this guide has been helpful. For any questions, please feel free to contact us.