We are excited to announce a major enhancement to our agricultural data service, further expanding its capabilities to support customized data analysis and visualization. Our platform, which already provides instant access to critical farmland indices—including Farmland Surface Temperature, NDVI, Farmland Moisture Index, Shadow & Sunlight Calculations, and Soil Data—now enables users to add and visualize their own geospatial data for deeper insights and better decision-making.
Key Features of the Service:
- Global Coverage: A valuable tool for agricultural professionals worldwide.
- Instant Insights: One-click access to farmland temperature, vegetation health, and moisture levels.
- User-Friendly Design: Accessible for users of all technical levels.
- Multilingual Support: Available in English, Japanese, Spanish, French, and Chinese.
- Shadow & Sunlight Calculations: Understand farmland shadows based on building structures and sunlight exposure.
- Comprehensive Soil Data: Gain insights into essential soil characteristics like pH, organic carbon, and nitrogen levels.
New Feature: Custom Data Upload & Visualization
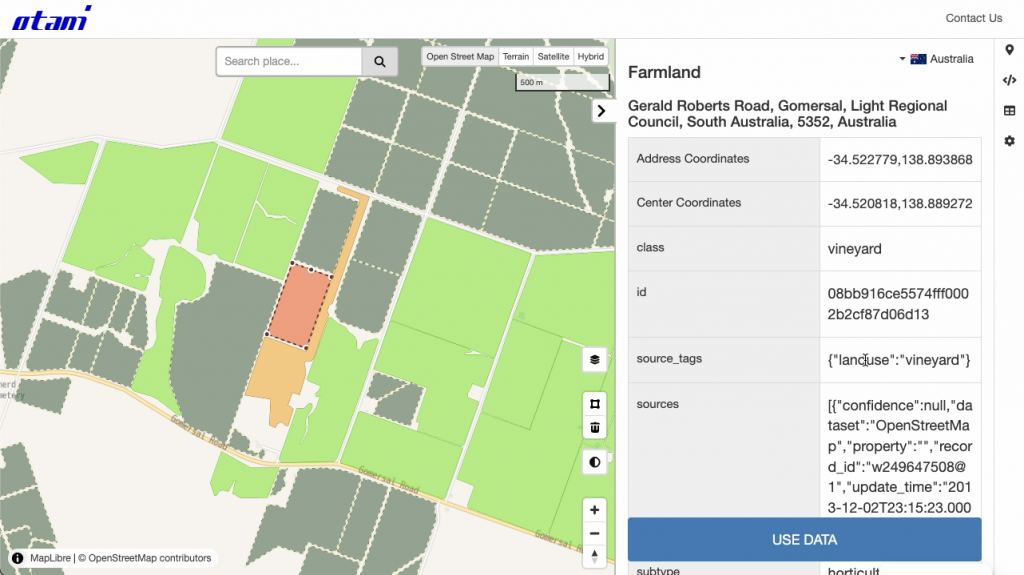
This week, we are introducing a new feature that allows users to add and visualize their own geospatial data. Key capabilities include:
- User Data Integration: Paste your own GeoJSON data into our editor, and visualize it directly on the map.
- Custom Data Retrieval: Extract relevant Farmland Surface Temperature, NDVI, Soil Data, and Sunlight Exposure based on your geospatial boundaries.
- Interactive Drawing Tool: No GeoJSON file? No problem! Users can draw polygons directly on the map to retrieve and analyze data for their selected farmland.
This new feature enhances flexibility and personalization, allowing farmers, agronomists, and researchers to integrate their own datasets for more precise analysis and decision-making.