Wheat is one of the world’s most important crops, essential for the production of a variety of food products such as bread, pasta, and pastries. The journey from wheat production on farms to flour sale in supermarkets involves several stages, including harvesting, processing, packaging, and distribution. Understanding this process helps to highlight the significant value chain that contributes to the availability of flour in supermarkets worldwide.
1. Wheat Production on Farms
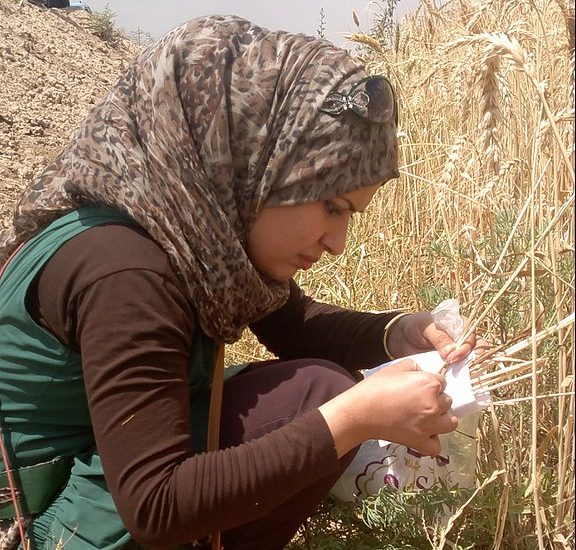
Planting
Wheat production begins with the planting of wheat seeds, typically in the fall or spring, depending on the climate and region. In most countries, wheat is grown on large-scale farms, where the primary varieties include hard red winter wheat, hard red spring wheat, soft red winter wheat, and durum wheat. Farmers choose the variety based on regional conditions and intended use (e.g., bread making, pasta production).
Growth and Development
Wheat grows through a series of stages: germination, tillering (production of side shoots), stem elongation, heading (flowering), and grain filling. Throughout these stages, farmers monitor the crop for water, nutrient levels, pests, and diseases, ensuring that optimal conditions are maintained for high yields.
Harvesting
Harvesting typically occurs in late spring or summer, when the wheat has matured and the grains are dry. Large combine harvesters are used to cut the wheat, separate the grains from the straw, and collect them. The harvested wheat is then transported to storage facilities or directly to processing plants.
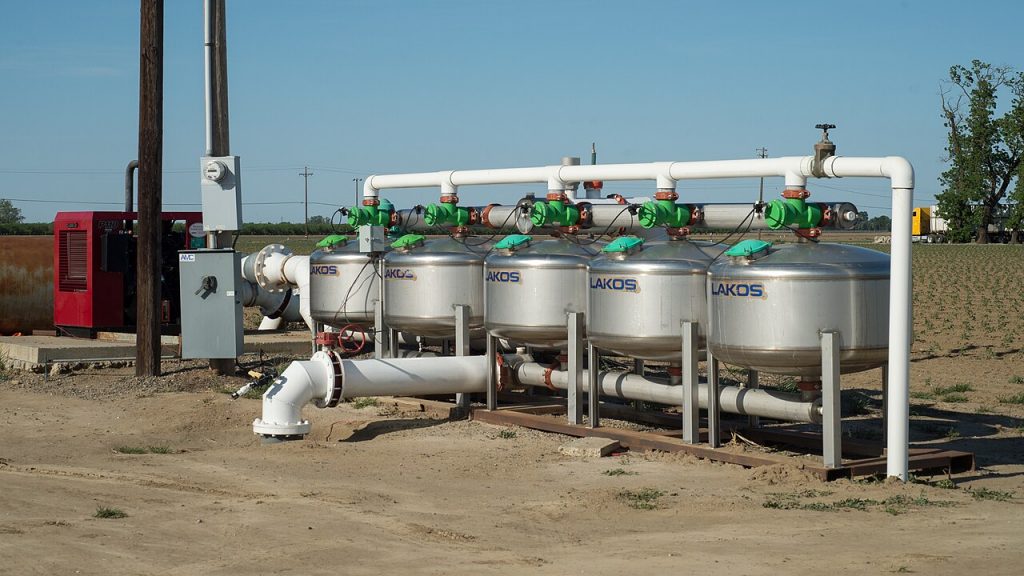
2. Wheat Storage
Once the wheat is harvested, it is transported to storage silos. Proper storage is essential to prevent spoilage, pest infestation, and loss of quality. Wheat is typically stored in large silos that control temperature and humidity to maintain the grain’s quality until it is ready for milling. Depending on the scale of production, wheat may be stored for several months before being processed.
3. Milling: The Transformation of Wheat to Flour
The next critical step in the wheat-to-flour process is milling. Milling involves grinding the wheat kernels into flour using specialized equipment in flour mills. The milling process generally follows these steps:
Cleaning and Conditioning
Before milling, the wheat undergoes cleaning to remove impurities such as dust, dirt, stones, and other foreign materials. It is also conditioned by adding water, which softens the wheat and makes it easier to grind.
Grinding and Sieving
The wheat kernels are then fed into mills, where they are crushed and ground into smaller particles. The resulting flour is separated into different grades through a series of sieves. The end product can range from whole wheat flour, which includes the entire grain, to refined white flour, where the bran and germ have been removed.
Milling by-products
During the milling process, by-products such as bran, germ, and wheat middlings are also produced. These by-products are often used in animal feed, or processed into other products, such as wheat bran for human consumption.
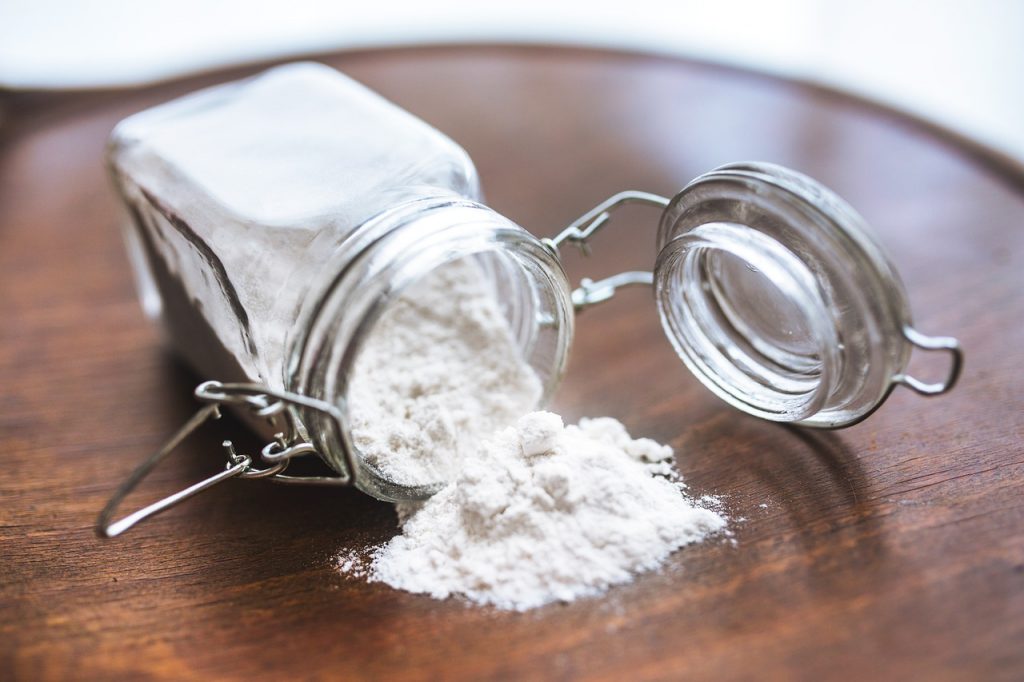
Packaging
Once the flour has been processed, it is packaged into bags of various sizes, depending on the market and consumer needs. The packaging includes labels with details such as the flour type, weight, expiration date, and nutrition information.
4. Flour Distribution and Sale
Once packaged, flour is distributed to wholesalers, retailers, and supermarkets. The flour distribution process typically involves several channels, including transportation by trucks or rail from the flour mills to regional warehouses, where it is stored before being sent to retail outlets.
Supermarkets and grocery stores usually purchase flour in bulk from wholesalers, who then sell it to consumers in smaller quantities. Retailers stock various types of flour, including all-purpose flour, bread flour, cake flour, and specialty flours such as gluten-free or organic varieties, catering to the diverse needs of consumers.
In some cases, flour is also sold directly to bakeries, restaurants, and other foodservice businesses, where it is used to produce bread, cakes, pastries, and other products.
5. Consumer Purchase
The final stage in the process occurs when consumers purchase flour from supermarkets or local stores. Consumers use flour to bake and cook a wide variety of food products at home. Flour is a staple ingredient in many households and is regularly purchased by individuals, families, and businesses.
Conclusion
The journey from wheat production on farms to the sale of flour in supermarkets is a complex process involving multiple stages, each of which adds value to the final product. From planting and harvesting to milling, packaging, and distribution, each step in the supply chain plays a critical role in ensuring that high-quality flour is available to consumers worldwide. This value chain is crucial not only for food production but also for the economies of countries that rely heavily on wheat as a staple crop. By understanding the entire process, we can appreciate the efforts and technologies behind bringing flour from farms to the shelves of supermarkets.

