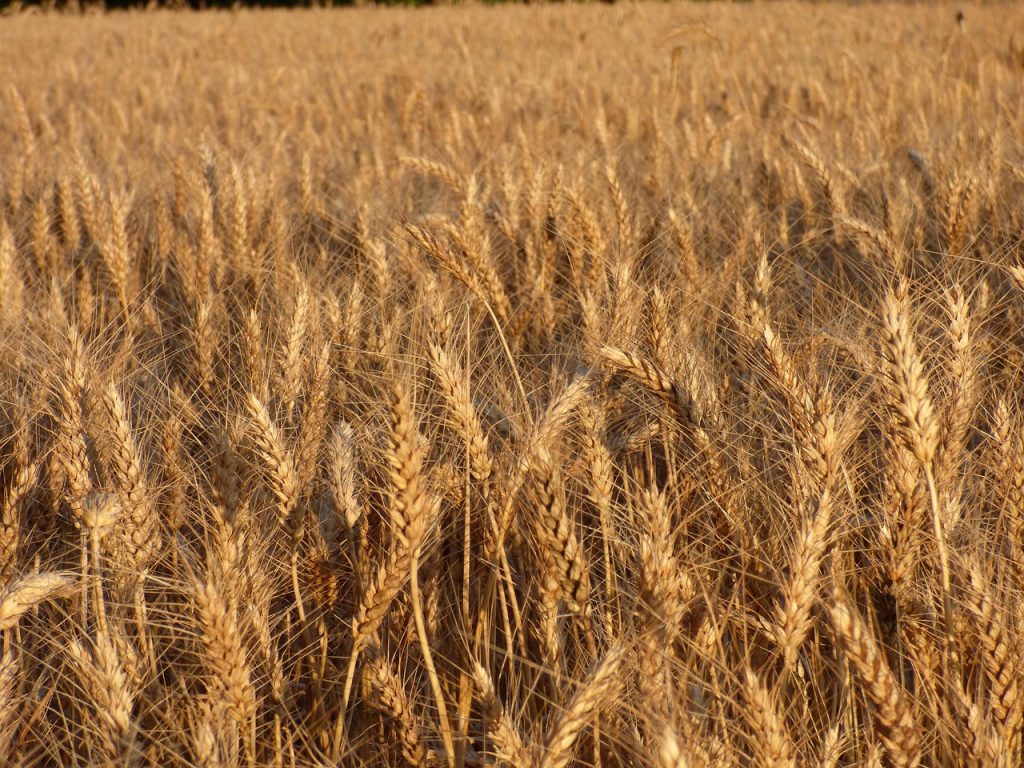
Australia is one of the world’s major wheat-producing countries, and its diverse climate and soil types make it an ideal environment for growing various types of wheat. The types of wheat cultivated in Australia vary depending on regional climatic conditions, the purpose of the wheat, and specific farming practices. In this article, we will explore the main wheat types grown in Australia, their characteristics, and the yields typically associated with each type.
1. Hard Red Winter Wheat
Characteristics
Hard Red Winter Wheat (HRWW) is a notable grain variety grown in the colder regions of Australia. This grain is recognized for its high protein content and strong gluten quality, making it ideal for bread production. The grains are typically reddish-brown, and HRWG is a high-yielding variety, valued for its ability to withstand harsh winter conditions. Its robust gluten is crucial for creating bread with excellent texture and volume.
HRWW is generally grown in areas with a cold winter and a moderate amount of rainfall. It requires a long growing season, which is why it thrives in regions that experience colder winters and cool spring conditions.
Yields
In Australia, Hard Red Winter Wheat typically yields around 2.5 to 3 tons per hectare, depending on the growing conditions and management practices. The yield can vary due to factors like soil fertility, climate conditions, and pest management strategies.
Major Growing Regions
HRWW is mainly cultivated in the southern regions of Australia, particularly in South Australia, Victoria, and New South Wales. These regions have a cool climate that is suitable for the winter wheat growing season.
2. Hard White Wheat
Characteristics
Hard White Wheat is another significant grain variety cultivated in Australia, primarily in the southern and western regions. It is considered a higher-quality grain, widely used for making various products, such as Asian noodles, bread, and other baked goods. Hard White Grain has lighter-colored kernels compared to Hard Red varieties and offers a slightly milder flavor.
This grain variety has a high gluten content, making it an excellent choice for high-end bakery products. It is resistant to certain diseases and can be grown in moderately dry regions, which is why it has become increasingly popular in Australia.
Yields
Hard White Wheat in Australia yields approximately 2 to 3 tons per hectare. The yield can vary depending on the region, with higher yields typically found in areas with good soil and irrigation systems. This wheat type is often grown in more arid areas where water availability may be a limiting factor.
Major Growing Regions
Hard White Wheat is predominantly grown in Western Australia and South Australia, where the growing conditions are more suited to this variety. These regions have dry, Mediterranean climates, which support the production of this wheat.
3. Soft Wheat
Characteristics
Soft wheat is recognized for its lower protein content and is primarily used in the production of cakes, biscuits, and other delicate baked goods. It thrives in regions with milder climates and requires less water than hard grain varieties. The grains of soft grain are lighter in color and have a softer texture, making them ideal for crafting delicate products like cakes and pastries.
Soft wheat grows best in well-drained soil with moderate rainfall. However, it is more vulnerable to diseases compared to hard grain, requiring farmers to implement effective pest and disease management strategies to maintain high-quality yields.
Yields
The yield of Soft Wheat in Australia can range from 1.5 to 2.5 tons per hectare, depending on environmental factors and farming practices. Soft wheat is less productive in regions with extreme temperatures but can thrive in more temperate areas.
Major Growing Regions
Soft wheat is mainly grown in the eastern regions of Australia, including parts of New South Wales, Queensland, and Tasmania. These regions have milder climates that support the cultivation of soft wheat, particularly during the spring and summer months.
4. Durum Wheat
Characteristics
Durum wheat (Triticum durum) is a hard wheat variety known for its high protein and gluten content, making it the ideal wheat for producing pasta. The grains are amber-colored and larger than those of bread wheat varieties. Durum wheat has a high starch content, which is essential for making pasta dough with the right texture and elasticity. It is also used in the production of semolina, a coarse wheat product used in pasta and couscous.
Durum wheat is grown in areas that have hot, dry climates, as it is well-suited to drought conditions. Its ability to thrive in arid regions makes it an important crop in Australia, where water scarcity can be a significant challenge for other types of wheat.
Yields
Durum wheat typically yields around 1.5 to 2 tons per hectare in Australia. Although it yields less than some other wheat types, it is highly valued for its quality and the specific products it can produce, such as pasta and semolina.
Major Growing Regions
Durum wheat is mainly grown in the drier, more arid regions of Australia, such as in parts of South Australia, New South Wales, and Western Australia. These regions provide the hot, dry conditions that are ideal for growing durum wheat, and they have extensive irrigation systems that help to manage water use.
5. Soft Red Winter Wheat
Characteristics
Soft Red Winter Wheat is similar to Soft Wheat, but it is grown specifically in areas with colder winter temperatures. It is primarily used for the production of cakes, crackers, and biscuits. This wheat type is characterized by its low protein content and soft texture, which makes it suitable for creating light, tender baked goods.
Yields
Soft Red Winter Wheat yields approximately 2 to 3 tons per hectare, depending on growing conditions and agricultural practices. This grain variety thrives in regions with cold winters and moderate rainfall.
Major Growing Regions
Soft Red Winter Wheat is primarily grown in the cooler regions of southern Australia, such as parts of Tasmania, Victoria, and South Australia.
Australian Wheat Types
Australia produces a variety of wheat types, each with its own unique characteristics and suitable growing conditions. The major wheat types in Australia include Hard Red Winter Wheat, Hard White Wheat, Soft Wheat, Durum Wheat, and Soft Red Winter Wheat, with each having specific uses, such as bread making, pasta production, and soft baked goods. Yields can vary depending on factors like climate, soil, and water availability, with some wheat types, such as Durum, yielding less but being valued for their high-quality products. Understanding these varieties and their growing regions helps farmers and consumers alike appreciate the diversity of Australian wheat production and its importance to the global wheat market.
Grain is one of the most significant staple crops worldwide, with different varieties cultivated based on end-use, growing conditions, and climate. Among these, durum grain and semolina stand out for their distinct properties and wide-ranging applications. This article delves into the various types of grain, emphasizing durum grain, semolina, their features, uses, and the regions and countries where they are grown.
1. Durum Wheat: The Hardest among All Wheat Types
Characteristics
Durum wheat (Triticum durum) is a hard variety of wheat known for its high protein content and strong gluten, which makes it ideal for producing pasta, couscous, and certain types of bread. It is distinguished from other wheat types by its large, amber-colored grains. Durum wheat is harder than common wheat varieties and is typically ground into semolina, a coarse flour with a yellowish tint that is a key ingredient in many Mediterranean dishes.
Durum wheat has a relatively high tolerance for hot, dry climates and is known for its resilience against drought conditions. It requires well-drained soil and can be grown in regions where rainfall is limited, although it still requires irrigation to thrive in some areas.
Key Uses
Durum wheat is primarily used for producing pasta and is the preferred choice for making pasta products such as spaghetti, macaroni, and lasagna. It is also used in making certain types of bread, especially in Mediterranean and Middle Eastern cuisines, such as focaccia and couscous. Durum wheat semolina is prized for its texture and elasticity, giving pasta a firm bite when cooked.
Key Producing Regions and Countries
Durum wheat is primarily grown in regions with hot, dry climates. Some of the top producers of durum wheat include:
Canada: Canada is the largest exporter of durum wheat, particularly in the Prairie provinces of Saskatchewan, Alberta, and Manitoba. The cool growing season in Canada is ideal for durum wheat production.
Italy: Known for its pasta-making tradition, Italy is one of the largest consumers and producers of durum wheat in Europe. The southern regions, including Sicily and Puglia, are key growing areas.
United States: In the U.S., durum wheat is mainly grown in North Dakota, Montana, and parts of Idaho. These areas have favorable climates for durum wheat production.
Turkey: Durum wheat is widely grown in Turkey, especially in the southeastern regions, where it is used to produce couscous and other traditional products.
Syria and Morocco: These countries in North Africa and the Middle East also cultivate significant amounts of durum wheat, with Morocco being a major producer in the region.
2. Semolina: Coarse Flour from Durum Wheat
Characteristics
Semolina is a coarser flour made from durum wheat, and it is often used in pasta production. The term “semolina” refers to the granular texture of the flour, which is produced by milling the durum wheat kernels into a coarse consistency. Semolina is high in protein and gluten, providing excellent texture and elasticity to dough. It is typically golden yellow in color and has a distinct nutty flavor.
Semolina flour is further divided into different grades based on its fineness. The finer grades are used for pasta production, while coarser grades are used in couscous and other food products.
Key Uses
Semolina is primarily used in the production of pasta, where its coarse texture helps give the pasta a firm and chewy texture when cooked. It is also used in making couscous, a popular dish in North Africa, and in various desserts, such as semolina pudding and halva.
Key Producing Regions and Countries
Semolina is produced wherever durum wheat is grown, as it is the main product of durum wheat milling. The countries that produce semolina are largely the same as those that grow durum wheat. These include:
Italy: As one of the largest consumers of durum wheat, Italy also produces a significant amount of semolina, primarily used for pasta production.
India: India produces semolina as well, particularly in the southern and western regions, where it is used to make upma, a popular breakfast dish, and other traditional recipes.
Egypt: Semolina is an important ingredient in Egyptian cuisine, where it is used to prepare dishes like koshari (a traditional rice and lentil dish) and desserts like basbousa.
United States: In the U.S., semolina is produced in areas where durum wheat is grown, particularly in the northern Great Plains states like North Dakota and Montana.
3. Other Types of Wheat and Their Characteristics
Bread Wheat (Common Wheat)
One of the most extensively cultivated wheat types is bread grain (Triticum aestivum). It is mainly utilized for making bread and other baked products. Compared to durum grain, bread grain has a softer texture and greater versatility in its applications.
Key Producing Regions: Russia, the United States, China, India, and the European Union are the largest producers of bread wheat.
Soft Red Winter Wheat
Soft red winter wheat is another type of wheat known for its relatively low protein content. It is primarily used for making cakes, cookies, crackers, and other baked goods that require a softer texture.
Key Producing Regions: The United States, particularly in the Midwest and Eastern regions, is a significant producer of soft red winter wheat.
Hard Red Winter Wheat
Hard red winter wheat is a variety with higher protein content and stronger gluten, used in bread production, particularly for making high-quality breads.
Key Producing Regions: Major producers of hard red winter wheat include the United States (Kansas, Nebraska, and Oklahoma), Canada, and Russia.
Conclusion
Different types of wheat are suited to various applications, with durum wheat and semolina being especially valued for their role in pasta production and Mediterranean cuisine. Durum wheat, with its high protein content and resistance to dry conditions, is primarily grown in regions such as Canada, Italy, and the United States. Semolina, made from durum wheat, is produced and used worldwide, particularly in regions where pasta and couscous are staple foods. Other wheat varieties, such as bread wheat and soft and hard red winter wheat, have their own unique uses and are produced in many countries around the world. The diversity of wheat types and their applications highlight the global importance of wheat production in feeding populations and sustaining economies.
Wheat is a staple crop and one of the most important agricultural commodities in global trade. It is essential not only for domestic food production but also for international markets, where countries rely on wheat imports and exports to meet their demands. Both wheat grains and wheat flour are traded internationally, and the flow of wheat across borders plays a critical role in the global food supply chain. This article introduces the general process of importing and exporting wheat, the reasons behind these transactions, and the key factors influencing the trade.
1. Exporting Wheat: A Critical Contributor to Global Markets
Key Exporting Countries
Several countries are key exporters of wheat, playing a vital role in the global supply of this important crop. These countries include Russia, the United States, Canada, Australia, and France. These regions are often known for their favorable climate and large-scale wheat farming operations, enabling them to produce significant quantities of wheat for export.
Reasons for Exporting Wheat
Surplus Production: Many of the leading wheat-exporting countries produce more wheat than they need for domestic consumption. This surplus is exported to meet the needs of other countries that may not have sufficient resources to grow enough wheat domestically.
Economic Benefits: Exporting wheat provides a significant source of income for the countries involved. By selling wheat to international markets, countries can boost their agricultural sector’s profitability and strengthen their overall economy.
Global Demand: Wheat is a staple food crop with a broad range of uses, from bread-making to pasta production. The demand for wheat remains high globally, especially in regions with high population growth, such as parts of Asia, Africa, and the Middle East. Countries that produce excess wheat can tap into these growing markets, ensuring their agricultural sector remains strong.
Food Security: By exporting wheat, countries help ensure global food security. Wheat is essential to feeding millions of people around the world, and through trade, nations can provide a reliable supply to countries experiencing food shortages.
Exporting Wheat Flour vs. Wheat Grain
Countries may choose to export wheat grain or wheat flour depending on factors such as cost, market demand, and infrastructure.
Wheat Grain: Exporting raw wheat grain is often more economical than flour because it requires less processing. Additionally, raw wheat is a versatile commodity that can be used by flour mills in importing countries to meet local demand.
Wheat Flour: On the other hand, exporting flour offers value-added benefits. By exporting processed flour instead of raw wheat, countries can increase their profit margins, as flour is a higher-value product. Additionally, exporting flour can help meet the needs of countries with limited milling capacity or where demand for processed food is higher.
2. Importing Wheat: Meeting Domestic Demands
Key Importing Countries
Countries that lack the climatic conditions, land area, or infrastructure to produce sufficient wheat rely on imports to meet their domestic demand. These countries include many in the Middle East, North Africa, and parts of Asia, where wheat consumption is high but local production is limited. Notable wheat importers include Egypt, Indonesia, Algeria, and Japan.
Reasons for Importing Wheat
Insufficient Domestic Production: Not all countries are able to grow wheat in sufficient quantities to meet their population’s needs. Harsh climatic conditions, limited arable land, or poor agricultural infrastructure may make wheat production challenging. In such cases, importing wheat becomes necessary to fill the gap between domestic production and consumption.
Price and Economic Factors: Sometimes, importing wheat can be more cost-effective than producing it domestically. For example, countries with high labor costs or unfavorable growing conditions may find that importing wheat is cheaper than investing in local production. Global wheat prices fluctuate due to factors like weather conditions and market trends, and some countries take advantage of lower prices from exporting countries.
Food Security: Just as exporting wheat helps to stabilize global food security, importing wheat is crucial for countries that rely on wheat as a major dietary staple. Ensuring a steady supply of wheat through imports helps safeguard against potential shortages caused by poor harvests or other disruptions in domestic production.
Diversification of Supply Sources: Relying on domestic wheat alone can be risky if local production faces setbacks such as bad weather or disease outbreaks. By importing wheat from different regions, countries can reduce their dependence on a single source and ensure a more stable supply.
Importing Wheat Flour vs. Wheat Grain
Similar to exporting, the decision between importing wheat grain or wheat flour depends on various factors.
Wheat Grain: Many countries prefer to import wheat grain because it allows for local milling and creates jobs in the domestic milling industry. Importing raw wheat also offers greater flexibility in terms of storage and local processing to meet specific needs, such as different flour types.
Wheat Flour: On the other hand, some countries prefer to import wheat flour directly, especially those with limited milling capacity or countries that prioritize ready-to-use flour for food production. Flour is a more processed product and may be imported when it is needed in large quantities for baking and food manufacturing industries.
3. The Future of Wheat Trade
The global trade in wheat is influenced by a variety of factors, including economic conditions, trade policies, climate change, and technological advancements. As demand for wheat continues to grow, especially in developing regions, the global wheat market will likely expand. Countries may invest in more efficient production methods, research for drought-resistant wheat varieties, and improvements in infrastructure to meet the rising demand.
Trade agreements, tariffs, and subsidies can also impact the flow of wheat between countries. Political stability and trade relationships will continue to play a significant role in determining which countries export and import wheat and wheat products.
Conclusion
The trade of wheat, whether in its raw grain or processed flour form, plays an essential role in meeting global food demand. Wheat-producing countries export wheat to fulfill international demand, while countries with limited production capacity import wheat to ensure a stable food supply. The decision to export or import wheat, or wheat flour, depends on factors such as economic considerations, food security, local production capabilities, and market conditions. The continued importance of wheat in the global food system means that this trade will remain a critical part of the agricultural and economic landscape for years to come.
Wheat is one of the world’s most important crops, essential for the production of a variety of food products such as bread, pasta, and pastries. The journey from wheat production on farms to flour sale in supermarkets involves several stages, including harvesting, processing, packaging, and distribution. Understanding this process helps to highlight the significant value chain that contributes to the availability of flour in supermarkets worldwide.
1. Wheat Production on Farms
Planting
Wheat production begins with the planting of wheat seeds, typically in the fall or spring, depending on the climate and region. In most countries, wheat is grown on large-scale farms, where the primary varieties include hard red winter wheat, hard red spring wheat, soft red winter wheat, and durum wheat. Farmers choose the variety based on regional conditions and intended use (e.g., bread making, pasta production).
Growth and Development
Wheat grows through a series of stages: germination, tillering (production of side shoots), stem elongation, heading (flowering), and grain filling. Throughout these stages, farmers monitor the crop for water, nutrient levels, pests, and diseases, ensuring that optimal conditions are maintained for high yields.
Harvesting
Harvesting typically occurs in late spring or summer, when the wheat has matured and the grains are dry. Large combine harvesters are used to cut the wheat, separate the grains from the straw, and collect them. The harvested wheat is then transported to storage facilities or directly to processing plants.
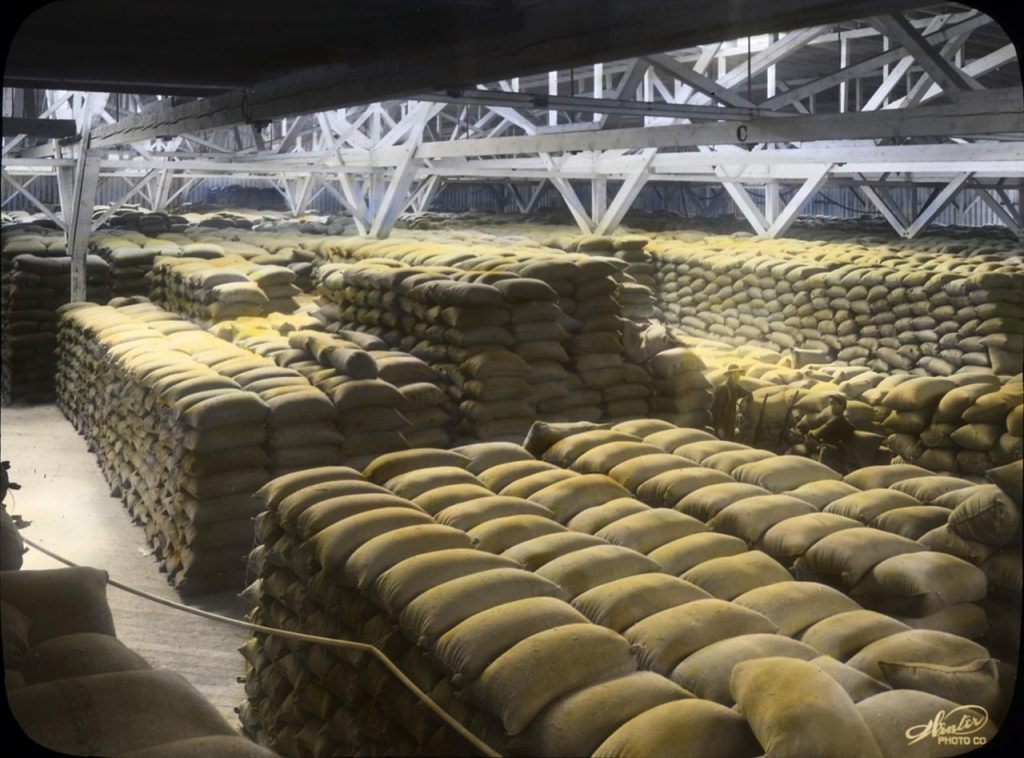
2. Wheat Storage
Once the wheat is harvested, it is transported to storage silos. Proper storage is essential to prevent spoilage, pest infestation, and loss of quality. Wheat is typically stored in large silos that control temperature and humidity to maintain the grain’s quality until it is ready for milling. Depending on the scale of production, wheat may be stored for several months before being processed.
3. Milling: The Transformation of Wheat to Flour
The next critical step in the wheat-to-flour process is milling. Milling involves grinding the wheat kernels into flour using specialized equipment in flour mills. The milling process generally follows these steps:
Cleaning and Conditioning
Before milling, the wheat undergoes cleaning to remove impurities such as dust, dirt, stones, and other foreign materials. It is also conditioned by adding water, which softens the wheat and makes it easier to grind.
Grinding and Sieving
The wheat kernels are then fed into mills, where they are crushed and ground into smaller particles. The resulting flour is separated into different grades through a series of sieves. The end product can range from whole wheat flour, which includes the entire grain, to refined white flour, where the bran and germ have been removed.
Milling by-products
During the milling process, by-products such as bran, germ, and wheat middlings are also produced. These by-products are often used in animal feed, or processed into other products, such as wheat bran for human consumption.
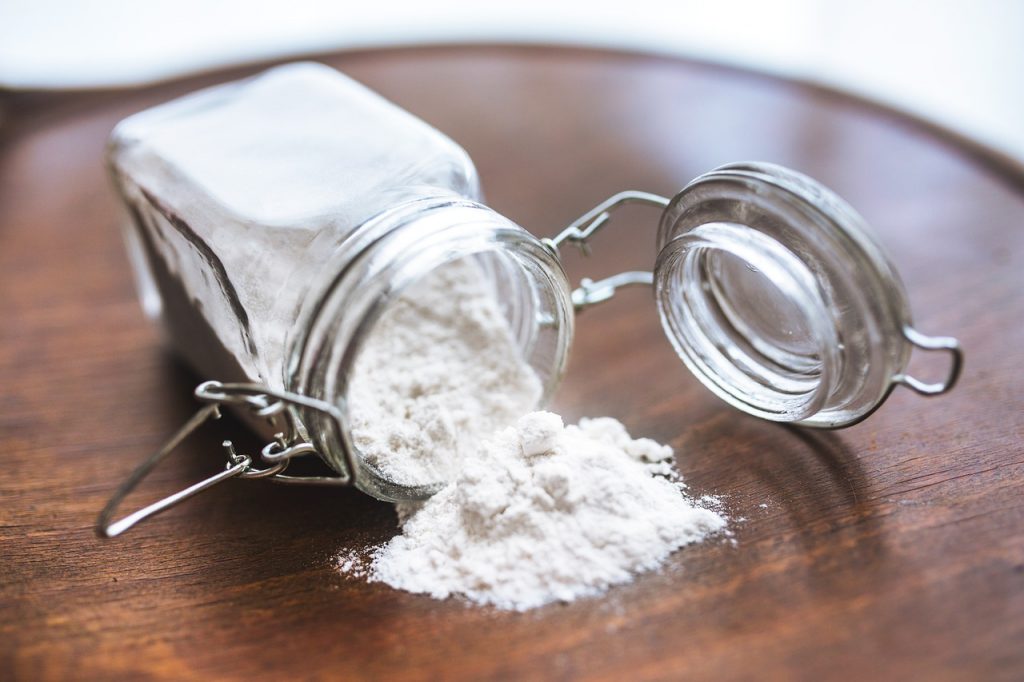
Packaging
Once the flour has been processed, it is packaged into bags of various sizes, depending on the market and consumer needs. The packaging includes labels with details such as the flour type, weight, expiration date, and nutrition information.
4. Flour Distribution and Sale
Once packaged, flour is distributed to wholesalers, retailers, and supermarkets. The flour distribution process typically involves several channels, including transportation by trucks or rail from the flour mills to regional warehouses, where it is stored before being sent to retail outlets.
Supermarkets and grocery stores usually purchase flour in bulk from wholesalers, who then sell it to consumers in smaller quantities. Retailers stock various types of flour, including all-purpose flour, bread flour, cake flour, and specialty flours such as gluten-free or organic varieties, catering to the diverse needs of consumers.
In some cases, flour is also sold directly to bakeries, restaurants, and other foodservice businesses, where it is used to produce bread, cakes, pastries, and other products.
5. Consumer Purchase
The final stage in the process occurs when consumers purchase flour from supermarkets or local stores. Consumers use flour to bake and cook a wide variety of food products at home. Flour is a staple ingredient in many households and is regularly purchased by individuals, families, and businesses.
Conclusion
The journey from wheat production on farms to the sale of flour in supermarkets is a complex process involving multiple stages, each of which adds value to the final product. From planting and harvesting to milling, packaging, and distribution, each step in the supply chain plays a critical role in ensuring that high-quality flour is available to consumers worldwide. This value chain is crucial not only for food production but also for the economies of countries that rely heavily on wheat as a staple crop. By understanding the entire process, we can appreciate the efforts and technologies behind bringing flour from farms to the shelves of supermarkets.
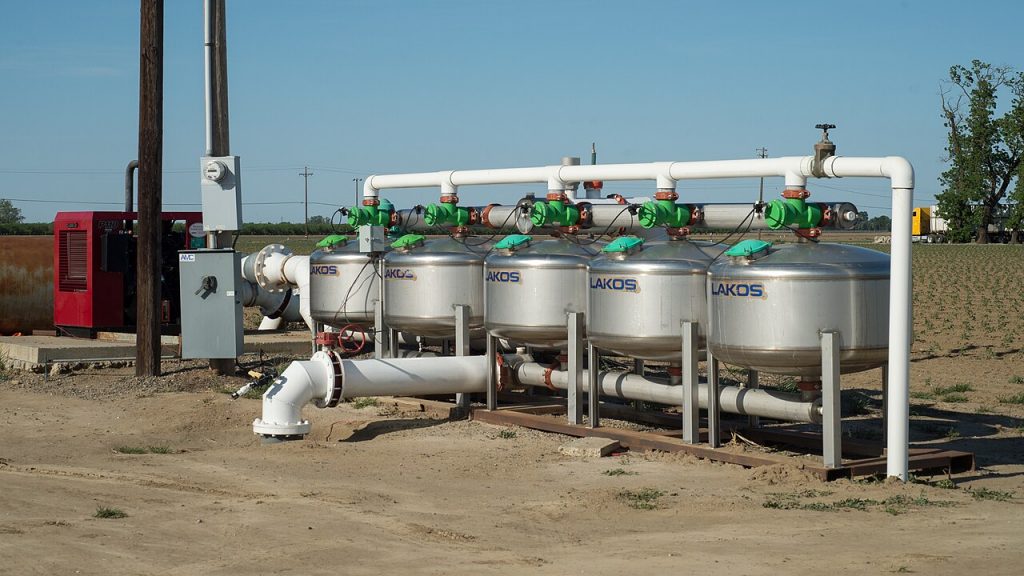
Irrigation plays a crucial role in ensuring successful wheat production, especially in regions where rainfall is insufficient or inconsistent. The right irrigation system can increase yield, improve water efficiency, and reduce the impact of droughts on wheat crops. Different regions around the world face varying challenges in water availability, soil conditions, and climate, and as such, the type of irrigation system used must be tailored to each region’s specific needs. In this article, we will explore the various irrigation systems suitable for wheat production in different parts of the world.
The Importance of Irrigation in Wheat Production
Wheat is a staple crop that requires substantial water for optimal growth. Insufficient irrigation can lead to stunted growth, poor grain filling, and reduced yields. Conversely, excessive irrigation can result in waterlogging, soil salinization, and increased susceptibility to diseases. Therefore, a well-designed and carefully managed irrigation system is essential for ensuring that wheat crops receive the right amount of water at the right time, especially in regions that experience irregular rainfall.
Types of Irrigation Systems
Several irrigation systems are used in wheat production, each with its advantages and limitations. The choice of system depends on factors such as water availability, field size, topography, and cost.
1. Surface Irrigation Systems
Surface irrigation is one of the oldest and most commonly used methods, particularly in regions with flat terrain and abundant water resources. In this system, water is applied directly to the soil surface through furrows, basins, or flood irrigation.
Suitable Regions:
India: India is one of the largest wheat producers in the world, and surface irrigation is widely used in the wheat-producing regions, especially in the states of Punjab, Haryana, and Uttar Pradesh. These areas have relatively flat terrain and ample water resources from rivers and canals.
China: In China, especially in the North China Plain, surface irrigation has been traditionally used for wheat production. The extensive canal systems and flat fields make this system viable.
Advantages:
Simple and low-cost installation.
Suitable for large areas and relatively flat terrain.
Works well in regions with abundant water resources.
Limitations:
Water wastage and inefficiency if not carefully managed.
Risk of soil salinization in areas with high evaporation rates.
2. Drip Irrigation Systems
Drip irrigation involves delivering water directly to the root zone of plants through a network of tubes and emitters. This system is highly efficient, using less water compared to surface irrigation, as it minimizes evaporation and runoff.
Suitable Regions:
Israel: Israel has long been a pioneer in drip irrigation technology, particularly in arid and semi-arid regions. Drip irrigation has been successfully used for wheat production in the Negev Desert and other parts of the country where water is scarce.
Australia: In Australia, where drought conditions are common, drip irrigation is becoming increasingly popular, especially in regions like New South Wales and South Australia, where wheat is grown.
Advantages:
High water-use efficiency, making it ideal for areas with limited water resources.
Reduces evaporation and runoff, making it environmentally sustainable.
Precise water delivery to the root zone improves plant health and yields.
Limitations:
High initial installation costs and maintenance.
Requires expertise for setup and management.
3. Center Pivot Irrigation Systems
Center pivot irrigation is a type of sprinkler irrigation that uses rotating towers to distribute water evenly over large, circular areas of land. This system is most effective in areas with relatively flat terrain and is widely used in regions with large-scale commercial wheat production.
Suitable Regions:
United States: In the Great Plains of the United States, which is one of the world’s largest wheat-producing regions, center pivot irrigation is commonly used. States like Kansas, Nebraska, and Oklahoma benefit from this system due to their expansive flat terrain and moderate water availability from underground aquifers.
Argentina: Argentina’s wheat-producing areas, particularly in the Pampa region, also rely on center pivot irrigation to efficiently manage water resources for wheat crops.
Advantages:
Suitable for large-scale wheat production due to its ability to cover extensive areas.
Efficient water distribution, reducing water wastage.
Automation reduces labor costs.
Limitations:
High capital investment for installation.
Requires a reliable source of water, such as groundwater or reservoirs.
4. Subsurface Drip Irrigation (SDI)
Subsurface drip irrigation is similar to traditional drip irrigation but involves burying the tubing below the soil surface. This system delivers water directly to the root zone, reducing evaporation and surface runoff.
Suitable Regions:
Egypt: In Egypt, where water resources are limited and irrigation is critical for wheat production, subsurface drip irrigation is gaining popularity. The system is particularly effective in regions like the Nile Delta, where water management is crucial.
Central Asia: Countries like Uzbekistan and Kazakhstan, where water scarcity is a concern, have implemented subsurface drip irrigation in wheat fields to improve water-use efficiency.
Advantages:
Highly efficient in water use, making it ideal for areas with water scarcity.
Reduces evaporation and surface runoff, which is beneficial in hot climates.
Improves soil structure and reduces weed growth.
Limitations:
High installation costs and maintenance.
Requires careful monitoring and management.
5. Flood Irrigation
Flood irrigation, also known as basin or flood irrigation, involves flooding the entire field with water. This traditional method is less commonly used today due to its inefficiency but can still be found in some regions.
Suitable Regions:
Pakistan: In Pakistan, particularly in the Sindh and Punjab regions, flood irrigation has been traditionally used for wheat production. The availability of water from the Indus River system supports this method.
Egypt: Flood irrigation is also common in Egypt, especially in the Nile Delta, where water from the Nile River is used to flood wheat fields.
Advantages:
Low installation and operational costs.
Can be used on large flat areas.
Limitations:
Very inefficient, leading to significant water wastage.
Risk of soil erosion and salinization.
Requires a large water supply.
Conclusion
The choice of irrigation system for wheat production is highly dependent on regional conditions, including climate, water availability, soil type, and the scale of farming operations. Surface irrigation remains a popular choice in regions with abundant water, such as India and China, while drip and subsurface irrigation systems are increasingly being adopted in areas facing water scarcity, such as Israel, Australia, and Egypt. Center pivot systems are ideal for large-scale wheat farming in regions like the United States and Argentina, offering efficient water distribution across vast areas. Each system has its advantages and limitations, and careful consideration is necessary to ensure that water resources are used efficiently, maximizing wheat yields while minimizing environmental impacts.
Manage Cookie Consent
We use technologies like cookies to store and/or access device information. We do this to improve browsing experience and to show personalized ads. Consenting to these technologies will allow us to process data such as browsing behavior or unique IDs on this site. Not consenting or withdrawing consent, may adversely affect certain features and functions.
Functional
Always active
The technical storage or access is strictly necessary for the legitimate purpose of enabling the use of a specific service explicitly requested by the subscriber or user, or for the sole purpose of carrying out the transmission of a communication over an electronic communications network.
Preferences
The technical storage or access is necessary for the legitimate purpose of storing preferences that are not requested by the subscriber or user.
Statistics
The technical storage or access that is used exclusively for statistical purposes.The technical storage or access that is used exclusively for anonymous statistical purposes. Without a subpoena, voluntary compliance on the part of your Internet Service Provider, or additional records from a third party, information stored or retrieved for this purpose alone cannot usually be used to identify you.
Marketing
The technical storage or access is required to create user profiles to send advertising, or to track the user on a website or across several websites for similar marketing purposes.

.jpg)