Offering easy-to-use satellite data for all professionals — Accessible in Five Languages
We are pleased to announce the launch of its new data store, a platform designed to make high-quality satellite data more accessible to professionals across industries. The store features data products from leading satellite programs, including Copernicus, NOAA, and JAXA, and offers user-friendly formats such as CSV and GeoJSON, allowing consultants, marketers, and other non-technical users to easily work with satellite data.
Key Features of the O2 Data Store:
Initial data products include:
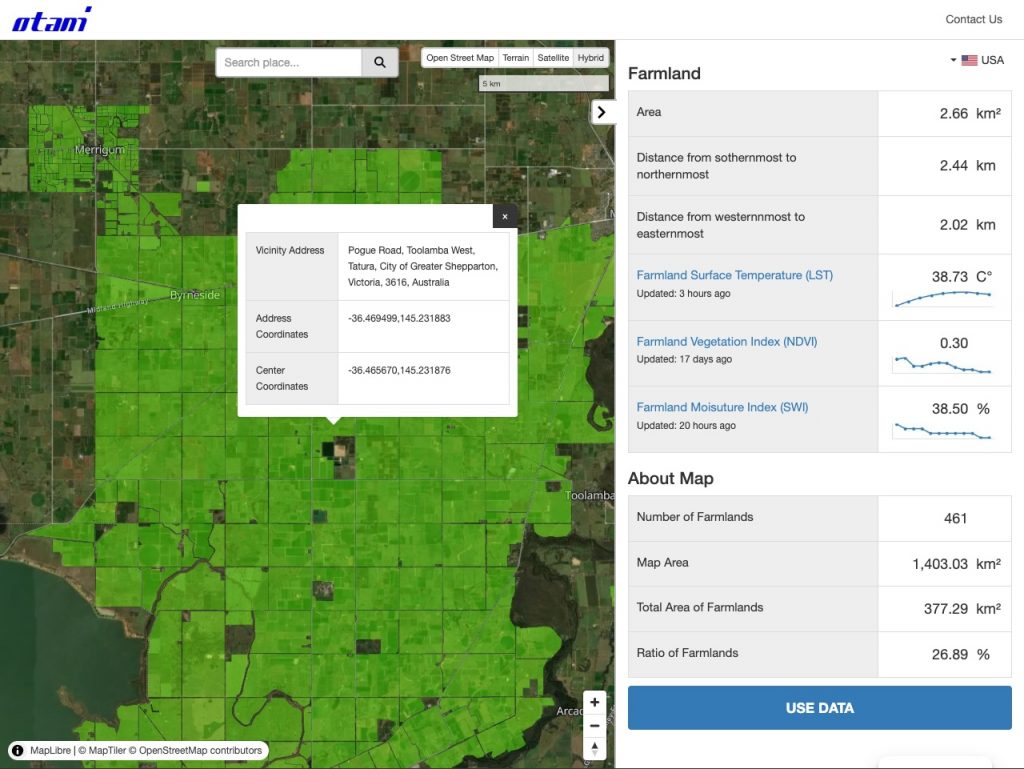
Normalized Difference Vegetation Index (NDVI)
Soil Water Index Global (SWI)
Land Surface Temperature (LST)
Sea Surface Temperature (SST)
Additional datasets such as precipitation rate will be available soon.
Global access in five languages – The store supports English, Japanese, Spanish, French, andChinese, ensuring accessibility for a worldwide audience. (Customer support is available in English and Japanese only.)
Flexible and affordable pricing:
Hourly updating data (e.g., LST, SWI) – 330 JPY per 744-hour (31-day) unit
Daily and 10-day updating data (e.g., NDVI) – 660 JPY per 366-day (1-year) unit
Multi-month purchases are available at proportional rates.
Instant access – Purchased data is accessible via a downloadable URL provided after payment.
Broad application – While designed for finance, agriculture, and journalism, the data can be used across various industries.
The O2 Data Store provides an easy and affordable way for professionals to access essential environmental and climate data without requiring deep technical expertise.
Supporting the Grain, Finance, and Media Industries with Reliable Satellite Data
Yokohama, Japan – January 14, 2025 – Otani & Co. is pleased to announce the launch of “O2 Grain Pulse – Spring Wheat”, a global crop production index based on satellite data. Utilizing data from sources such as Copernicus satellites, this platform provides timely and consistent insights into global spring wheat productivity.
Key Features of “O2 Grain Pulse – Spring Wheat”
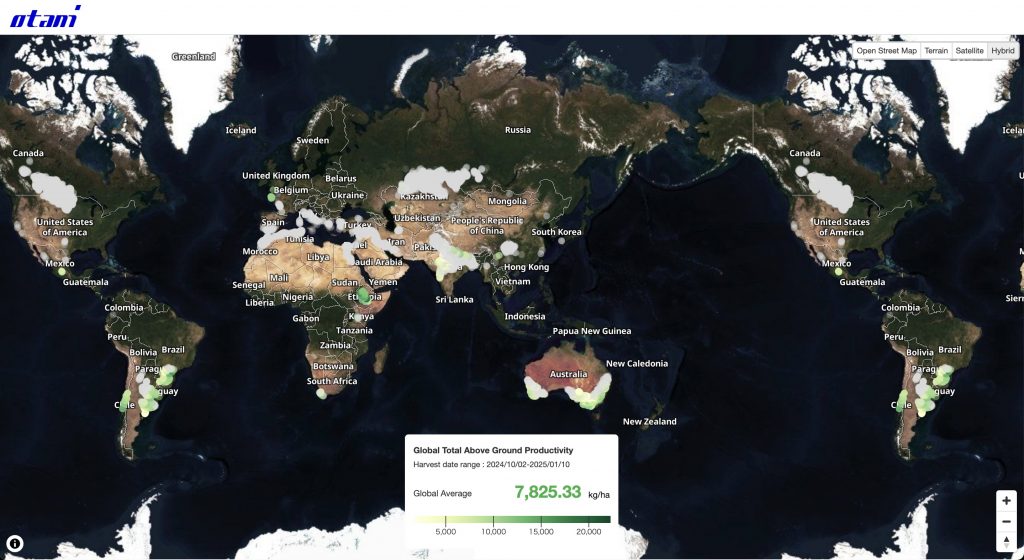
Global and Localized Data:
Offers metrics for Global Total Above Ground Productivity and localized Total Above Ground Productivity (TAGP) at two resolutions:
12.5 km x 12.5 km grids (approximately 30,000 globally)
300 m x 300 m grids (approximately 30 million globally)
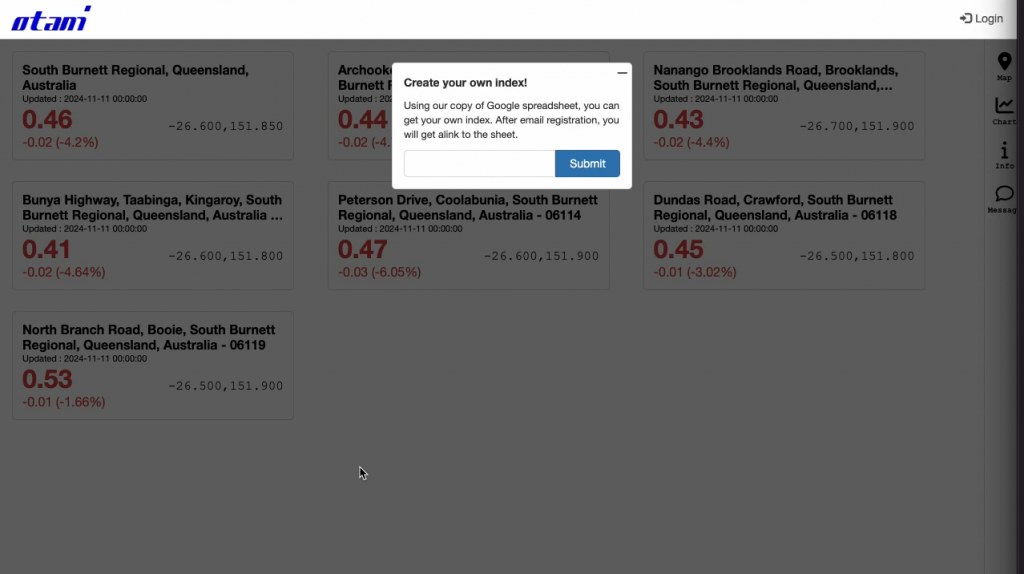
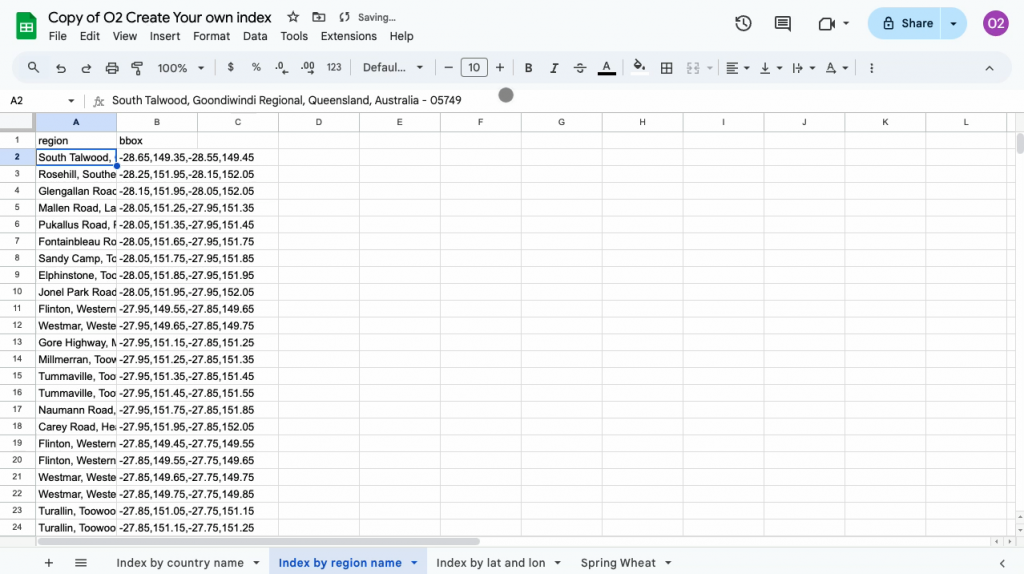
Accessible Data for Analysis:
Users can download TAGP data in CSV format, enabling comparisons across regions and countries. The consistent calculation methodology ensures reliable cross-border analyses.
Additional Metrics for High-Resolution Grids:
The 300 m x 300 m grids provide further details, including:
Estimated total above-ground productivity within the grid
Field area measurements• Predicted harvest quantities
Estimated market prices for wheat and flour
Regular Updates:
Data is refreshed daily for each grid, allowing users to combine datasets and generate new insights based on current information.
Broad Applications:
The platform’s datasets can be applied to:
Forecast commodity prices
Analyze stock market trends (e.g., Nikkei 225)
Evaluate the performance of companies in milling, food production, and dining sectors
Potential Future Enhancements:
Otani & Co. is considering integrating tools to generate detailed reports using imported datasets and satellite imagery, providing additional value for users.
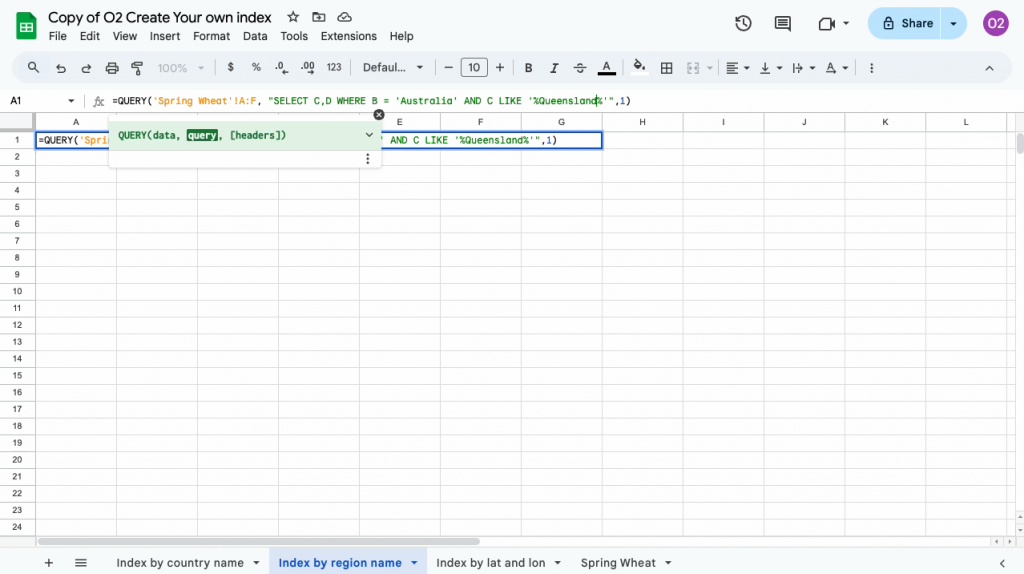
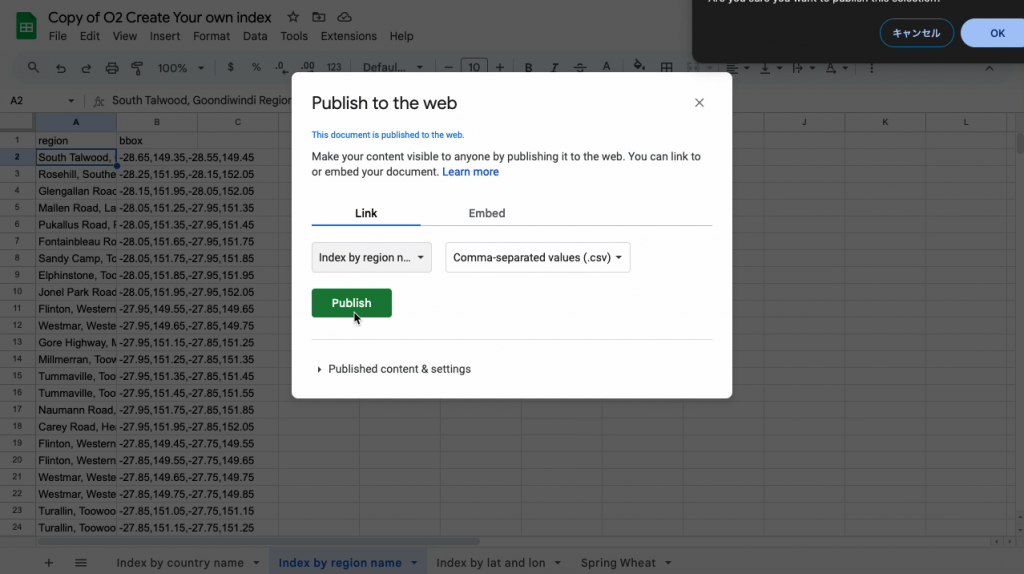
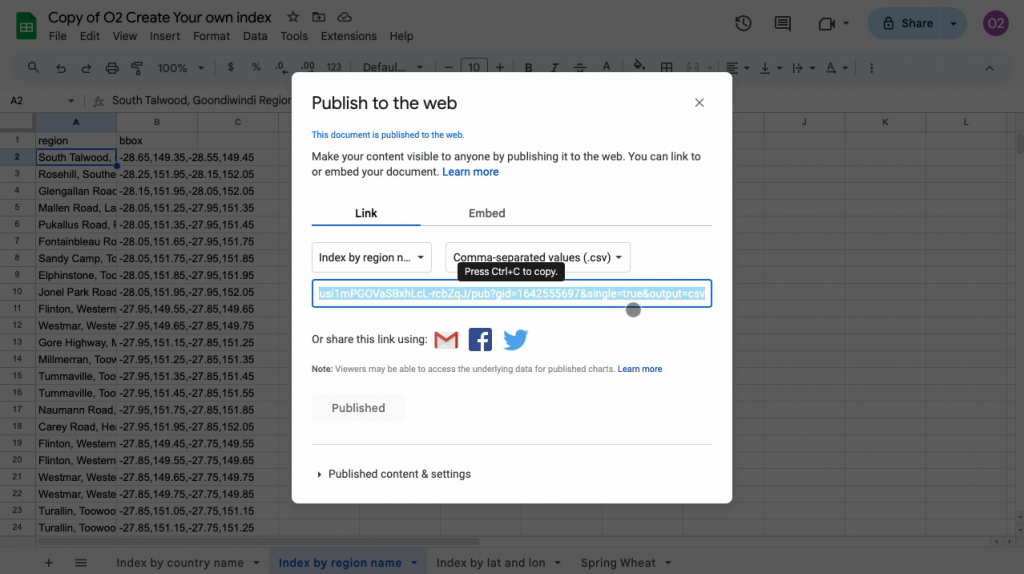
That’s it! You’ve successfully built your own index using a Google Spreadsheet. We hope this guide has been helpful. For any questions, please feel free to contact us.
We’re thrilled to announce significant updates to our shared map functionality! These enhancements provide greater control over data selection, improved visualization of location information, and convenient download capabilities.
Enhanced Data Selection:
Previously, viewing your entire dataset at once on the map wasn’t possible. This update empowers you to select specific data points for display. You can choose to display a single data point, multiple points, or your entire dataset. Simply click the eye icon next to the desired data points to make your selection.
Clearer Location Data Visualization:
Previously, even if latitude and longitude data existed within your dataset, it wasn’t readily viewable as a grid. We’ve addressed this issue! For CSV map data formats that include latitude and longitude columns, these coordinates will now be displayed directly within the grid. For GeoJSON data formats, a dedicated column named “_geojson” will be added to the grid. This column stores GeoJSON features as strings within each row.
Streamlined Data Download:
The most significant update is the introduction of a dedicated data download button. Clicking this button initiates the process of downloading all data utilized within the map. The downloaded file format will be CSV with UTF-8 encoding.
***
To help you explore these new features, we’ve created a helpful video tutorial available on YouTube.
Additionally, below is an example of a shared map showcasing wineries in Waiheke Island, New Zealand (courtesy of Open Street Map) alongside daily land surface temperature data (courtesy of JAXA) for March (Please note that the unit for the temperature is not Celsius but Kelvin).
We believe these updates will significantly enhance your shared map experience!
We use technologies like cookies to store and/or access device information. We do this to improve browsing experience and to show personalized ads. Consenting to these technologies will allow us to process data such as browsing behavior or unique IDs on this site. Not consenting or withdrawing consent, may adversely affect certain features and functions.
Functional
Always active
The technical storage or access is strictly necessary for the legitimate purpose of enabling the use of a specific service explicitly requested by the subscriber or user, or for the sole purpose of carrying out the transmission of a communication over an electronic communications network.
Preferences
The technical storage or access is necessary for the legitimate purpose of storing preferences that are not requested by the subscriber or user.
Statistics
The technical storage or access that is used exclusively for statistical purposes.The technical storage or access that is used exclusively for anonymous statistical purposes. Without a subpoena, voluntary compliance on the part of your Internet Service Provider, or additional records from a third party, information stored or retrieved for this purpose alone cannot usually be used to identify you.
Marketing
The technical storage or access is required to create user profiles to send advertising, or to track the user on a website or across several websites for similar marketing purposes.