In recent years, satellite technology has become an invaluable tool for revolutionizing agriculture, especially crop cultivation and farming. By providing precise, up-to-date information on various environmental and crop conditions, satellite data is empowering farmers, agribusinesses, and policymakers to make data-driven decisions that enhance productivity, sustainability, and food security.
The Role of Satellite Data in Agriculture
Satellite data offers unique insights into agricultural ecosystems by capturing information on land, vegetation, and weather at a global scale. Some of the most impactful applications include:
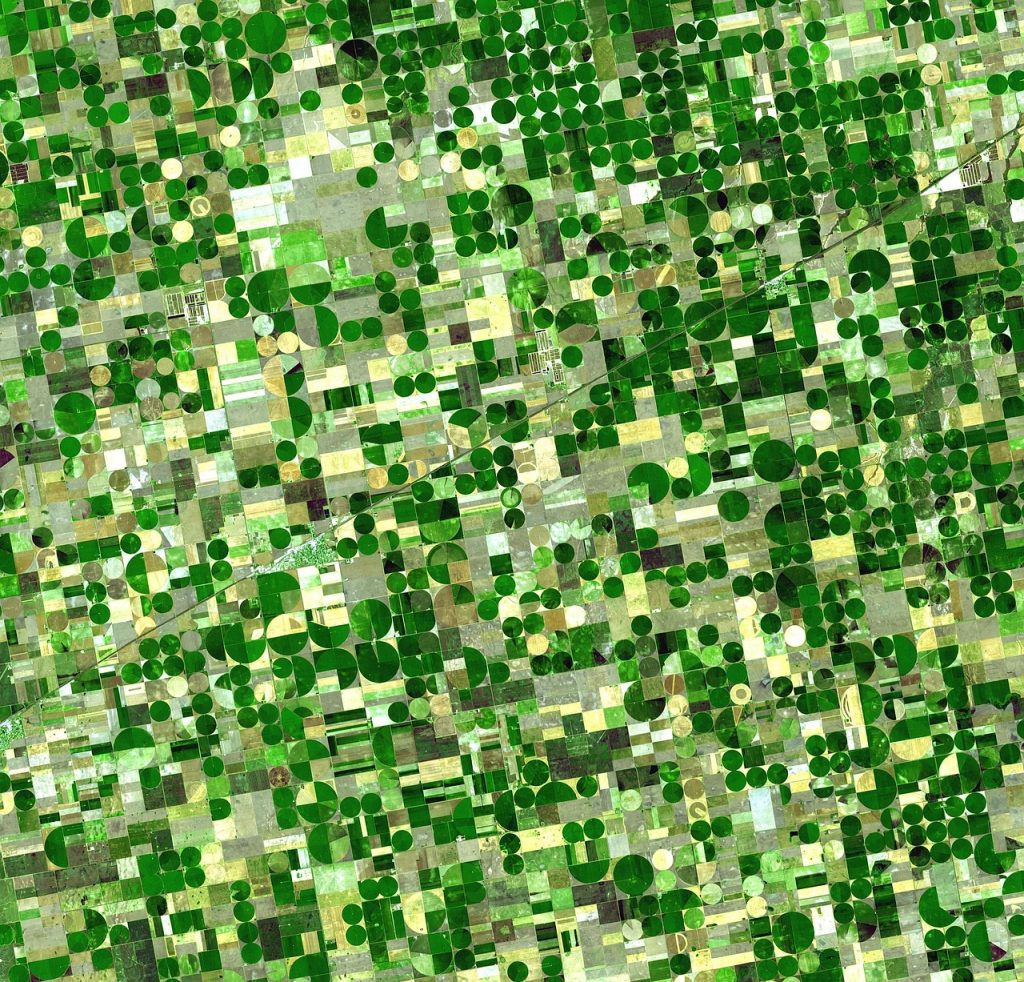
Monitoring Crop Health Satellites equipped with multispectral sensors, such as those on Sentinel-2 or Landsat, measure vegetation indices like the Normalized Difference Vegetation Index (NDVI). NDVI provides critical insights into plant health, enabling early detection of stress caused by pests, diseases, or water deficiencies.
Precision Farming Satellite imagery allows farmers to practice precision agriculture by targeting specific areas of a field for irrigation, fertilization, or pest control. This targeted approach minimizes resource waste and maximizes yields.
Drought and Water Management Satellites like SMAP (Soil Moisture Active Passive) monitor soil moisture levels, providing crucial data for efficient water management and drought preparedness. Such information helps farmers optimize irrigation schedules and conserve water resources.
Weather Forecasting and Climate Analysis By providing accurate and timely weather data, satellites help predict extreme weather events, enabling farmers to take preventive measures. Additionally, long-term climate data assists in planning crop rotations and selecting resilient crop varieties.
Land Use and Soil Mapping High-resolution satellite images are used to map land use and soil types, aiding in the identification of the most suitable areas for specific crops. This information also helps in monitoring deforestation and land degradation.
Case Studies: Real-World Applications
Improving Wheat Harvest Predictions Organizations are leveraging NDVI-based indices to estimate wheat yields accurately. These indices are updated regularly and provide valuable insights to farmers, media, and finance professionals about potential harvest outcomes.
Fighting Desertification in Africa In regions like the Sahel, satellite data is being used to monitor reforestation projects, assess the success of sustainable land management practices, and guide efforts to combat desertification.
Insurance for Smallholder Farmers Satellite-derived weather and crop data are increasingly used in parametric insurance schemes. These schemes provide payouts to farmers based on predefined triggers, such as drought or excessive rainfall, reducing the financial risks associated with farming.
Challenges and Opportunities
Despite its potential, the integration of satellite data in agriculture faces challenges:
Access and Affordability: High-resolution satellite imagery can be expensive, limiting its accessibility to small-scale farmers.
Technical Expertise: Farmers often require training to interpret satellite data effectively and integrate it into their practices.
Data Integration: Combining satellite data with other sources, such as IoT sensors and ground surveys, is crucial but can be complex.
Emerging technologies like generative AI, cloud computing, and open-access platforms are addressing these challenges. For instance, platforms that provide affordable, user-friendly dashboards for satellite data are becoming increasingly popular.
Future Prospects
The future of satellite data in agriculture looks promising. Advances in machine learning and artificial intelligence will enable more accurate and actionable insights. Moreover, as satellite technology becomes more affordable, its adoption by smallholder farmers is expected to grow, bridging the gap between technology and traditional farming practices.
In conclusion, satellite data is a game-changer for agriculture, offering tools to enhance productivity, sustainability, and resilience in the face of climate change. By harnessing its full potential, we can take significant strides toward achieving global food security.
Supporting the Grain, Finance, and Media Industries with Reliable Satellite Data
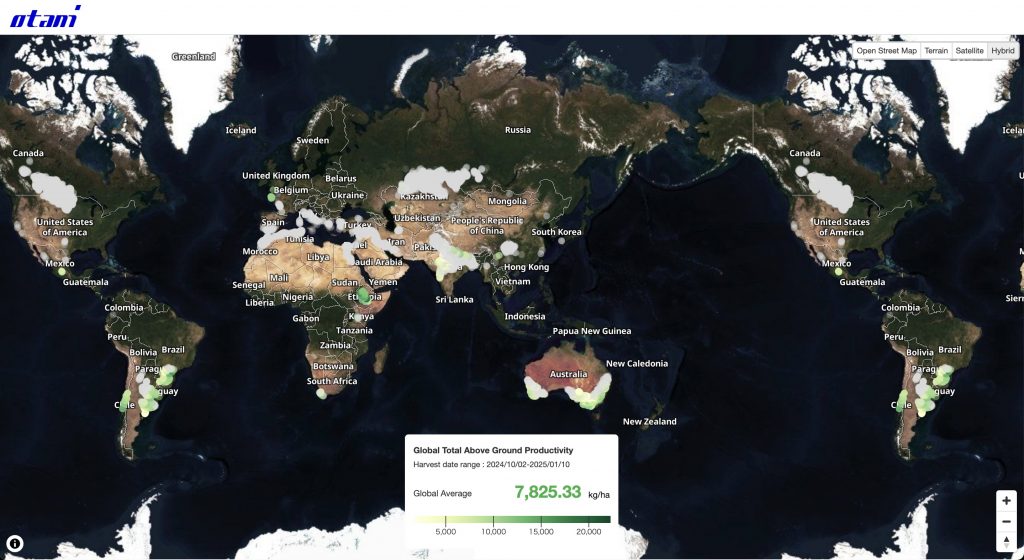
Yokohama, Japan – January 14, 2025 – Otani & Co. is pleased to announce the launch of “O2 Grain Pulse – Spring Wheat”, a global crop production index based on satellite data. Utilizing data from sources such as Copernicus satellites, this platform provides timely and consistent insights into global spring wheat productivity.
Key Features of “O2 Grain Pulse – Spring Wheat”
Global and Localized Data:
Offers metrics for Global Total Above Ground Productivity and localized Total Above Ground Productivity (TAGP) at two resolutions:
12.5 km x 12.5 km grids (approximately 30,000 globally)
300 m x 300 m grids (approximately 30 million globally)
Accessible Data for Analysis:
Users can download TAGP data in CSV format, enabling comparisons across regions and countries. The consistent calculation methodology ensures reliable cross-border analyses.
Additional Metrics for High-Resolution Grids:
The 300 m x 300 m grids provide further details, including:
Estimated total above-ground productivity within the grid
Field area measurements• Predicted harvest quantities
Estimated market prices for wheat and flour
Regular Updates:
Data is refreshed daily for each grid, allowing users to combine datasets and generate new insights based on current information.
Broad Applications:
The platform’s datasets can be applied to:
Forecast commodity prices
Analyze stock market trends (e.g., Nikkei 225)
Evaluate the performance of companies in milling, food production, and dining sectors
Potential Future Enhancements:
Otani & Co. is considering integrating tools to generate detailed reports using imported datasets and satellite imagery, providing additional value for users.
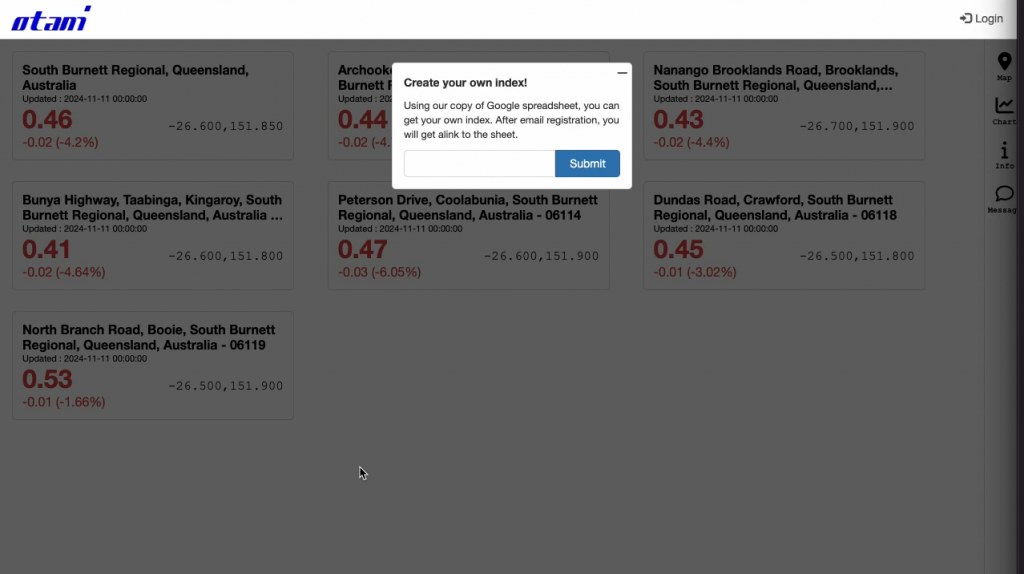
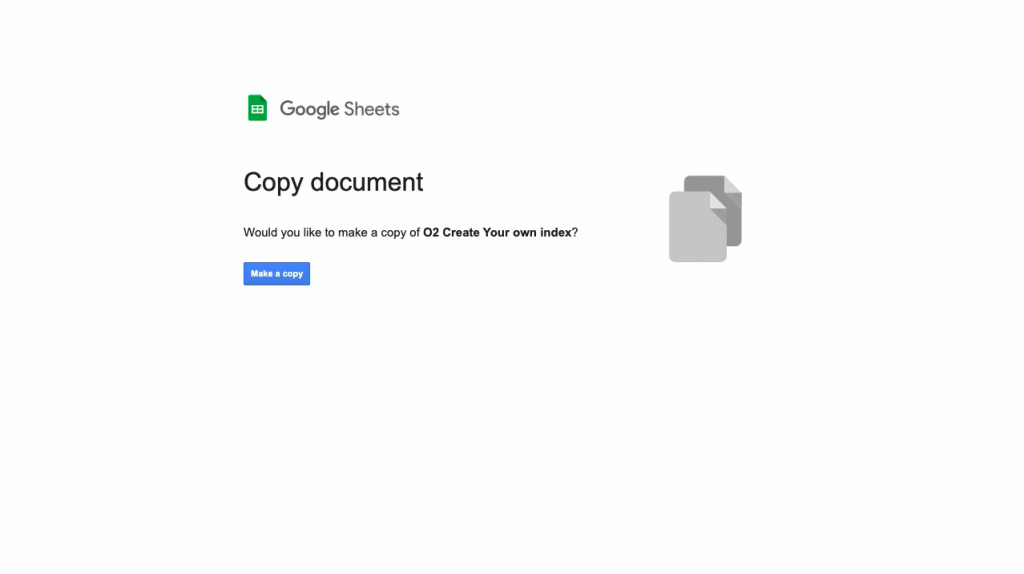
That’s it! You’ve successfully built your own index using a Google Spreadsheet. We hope this guide has been helpful. For any questions, please feel free to contact us.
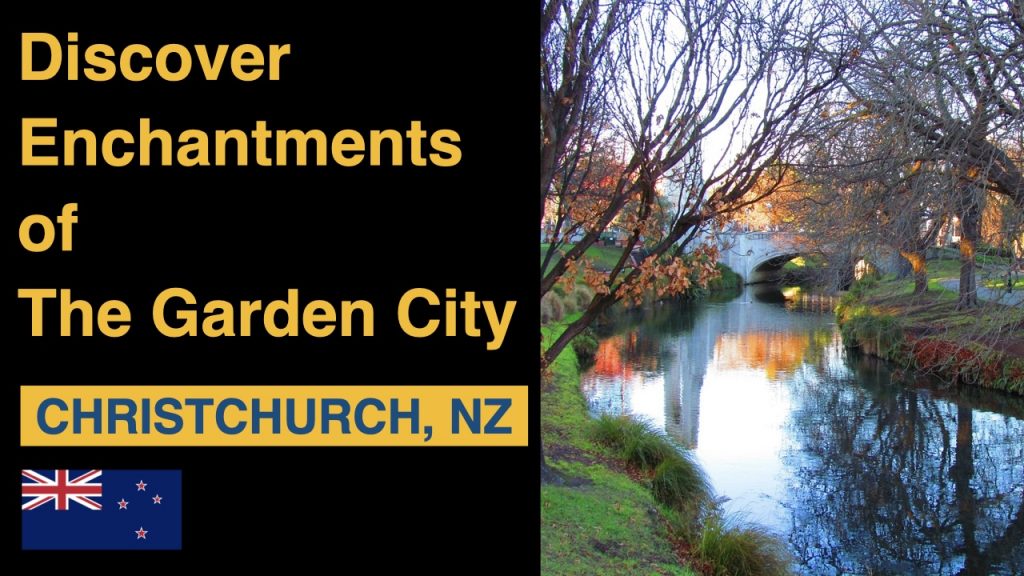
Today we are introducing, Christchurch, the Garden City of New Zealand, where lush greenery meets urban charm. This vibrant city, with its natural beauty and rich history, is ready to enchant you at every turn. From iconic landmarks to tranquil parks, Christchurch beckons you to discover its unique allure.
A Tapestry of History and Modernity
Christchurch is a city steeped in history and brimming with character. Founded in the early 19th century by English settlers, it quickly became a hub of commerce and culture on New Zealand’s South Island. Today, remnants of its colonial past mingle seamlessly with contemporary architecture, creating a unique tapestry of old and new. From the iconic Christchurch Cathedral to the bustling streets of Cathedral Square, the city invites you to step back in time and explore its storied past. Wander through heritage buildings, where each brick and stone tells a story of resilience and rebirth.
Nature’s Embrace: Gardens and Parks in Christchurch
Christchurch is renowned for its expansive parks and gardens, earning its moniker as the Garden City. The Botanic Gardens, established in 1863, is a verdant sanctuary in the heart of the city. Here, you can meander through themed gardens, marvel at exotic plant species, and relax by serene water features. The Avon River, winding gracefully through the city, offers picturesque settings for a leisurely punt ride or a peaceful riverside walk. Hagley Park, another gem, is perfect for picnics, sports, and enjoying the seasonal blooms that transform the landscape year-round.
Urban Vibrancy and Innovation
In the wake of the 2011 earthquake, Christchurch has risen with renewed vigor, showcasing innovation and creativity. The Re:START Mall, initially a symbol of resilience, has evolved into a bustling hub where repurposed shipping containers house trendy shops and cafes. The Christchurch Arts Centre, a neo-Gothic masterpiece, now serves as a thriving cultural venue, hosting exhibitions, performances, and markets that celebrate local talent and creativity. The Riverside Market, a food lover’s paradise, offers a culinary journey through fresh, local produce and gourmet delights.
A Cultural Kaleidoscope
Experience the vibrant tapestry of Māori culture that weaves through the fabric of Christchurch. From the rhythmic beats of the haka to the intricate carvings adorning local marae, the city is alive with the spirit of the indigenous people of New Zealand. Explore the depths of Māori heritage at cultural centers and museums, where traditional performances and exhibitions offer a glimpse into ancient customs and traditions. Embrace the warmth of manaakitanga (hospitality) as you immerse yourself in the traditions and stories passed down through generations. In Christchurch, Māori culture is not just a part of history—it’s a living, breathing force that continues to shape and enrich the city’s identity.
The Flavors of Canterbury
Raise a glass to the exquisite wines of Canterbury, where sun-drenched vineyards and cool ocean breezes combine to produce some of New Zealand’s most acclaimed varietals. Explore the picturesque landscapes of Waipara Valley, home to world-class Pinot Noir, Riesling, and Chardonnay. Wander through the rows of grapevines at family-owned wineries, where passionate winemakers craft each bottle with care and precision. Indulge in cellar door tastings, where every sip tells a story of terroir and tradition. Whether you’re a seasoned oenophile or simply seeking to expand your palate, Canterbury’s wineries invite you on a journey of discovery, one glass at a time.
Farewell, But Not Goodbye
As our journey through Christchurch comes to a close, we hope you’ve been inspired by the beauty, culture, and spirit of this remarkable city. From its lush gardens to its rich history, from the warmth of Māori hospitality to the flavors of its world-class wines, Christchurch offers something truly special for every traveler. As you bid farewell to this enchanting destination, remember that the door is always open for your return. Until we meet again, may your memories of Christchurch be as vibrant and unforgettable as the experiences you’ve shared.
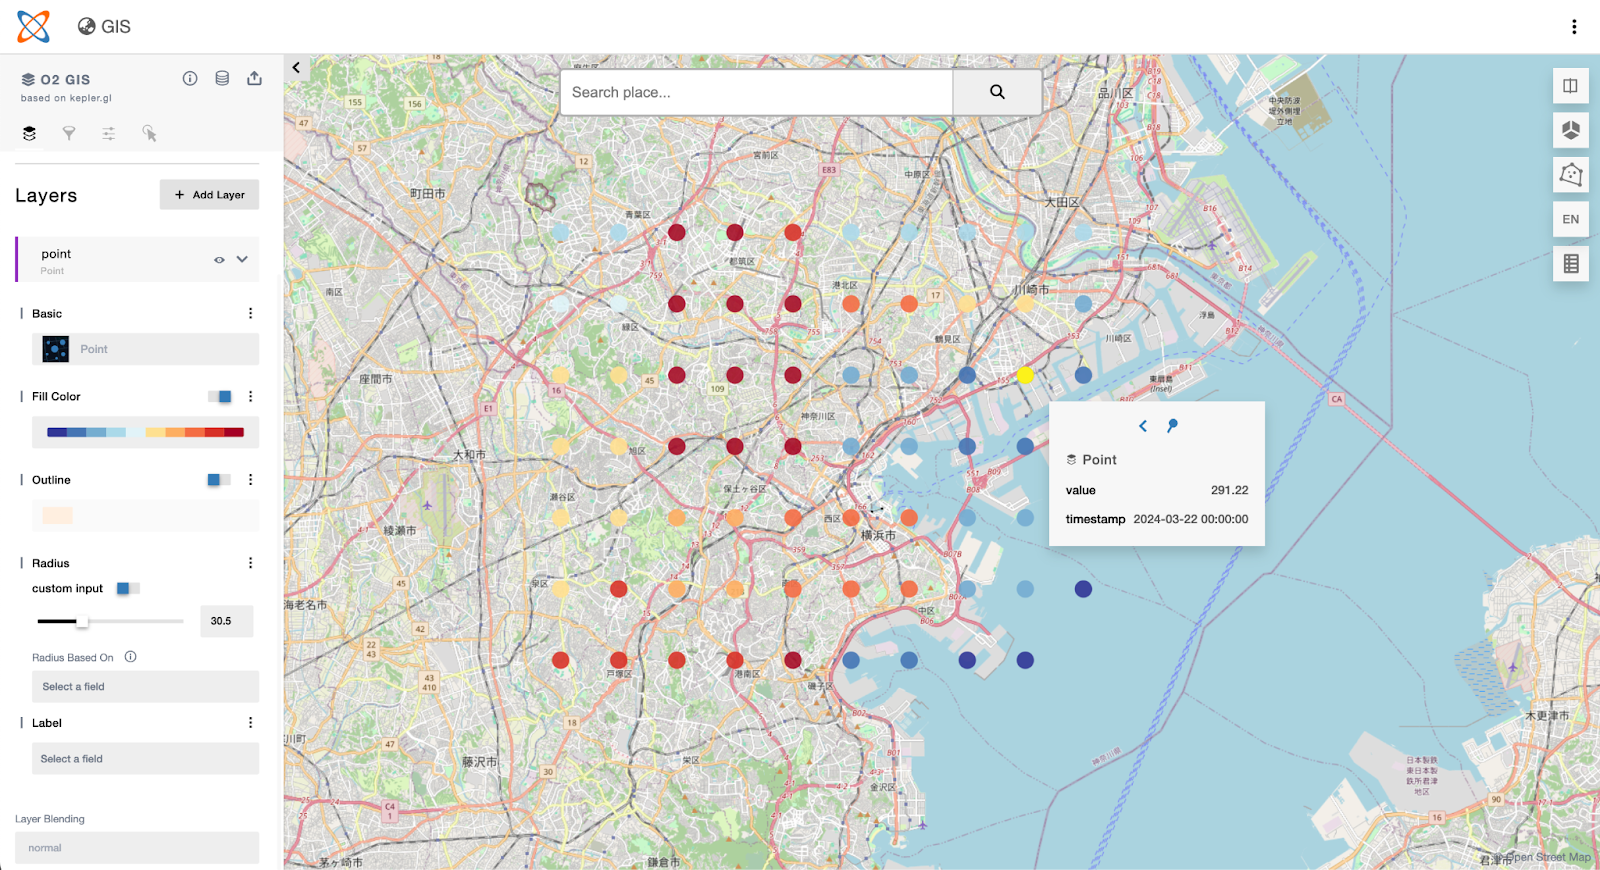
We’re thrilled to announce significant updates to our shared map functionality! These enhancements provide greater control over data selection, improved visualization of location information, and convenient download capabilities.
Enhanced Data Selection:
Previously, viewing your entire dataset at once on the map wasn’t possible. This update empowers you to select specific data points for display. You can choose to display a single data point, multiple points, or your entire dataset. Simply click the eye icon next to the desired data points to make your selection.
Clearer Location Data Visualization:
Previously, even if latitude and longitude data existed within your dataset, it wasn’t readily viewable as a grid. We’ve addressed this issue! For CSV map data formats that include latitude and longitude columns, these coordinates will now be displayed directly within the grid. For GeoJSON data formats, a dedicated column named “_geojson” will be added to the grid. This column stores GeoJSON features as strings within each row.
Streamlined Data Download:
The most significant update is the introduction of a dedicated data download button. Clicking this button initiates the process of downloading all data utilized within the map. The downloaded file format will be CSV with UTF-8 encoding.
***
To help you explore these new features, we’ve created a helpful video tutorial available on YouTube.
Additionally, below is an example of a shared map showcasing wineries in Waiheke Island, New Zealand (courtesy of Open Street Map) alongside daily land surface temperature data (courtesy of JAXA) for March (Please note that the unit for the temperature is not Celsius but Kelvin).
We believe these updates will significantly enhance your shared map experience!
For the Analysis of Time-Spatial Data & Satellite Data
Yokohama, Japan – April 2, 2024 – O2, a new service that simplifies the visualization and sharing of geospatial data, has officially launched. It is designed to meet the needs of a wide range of users, from GIS professionals to business users and students.
Key Features
Easy-to-use interface – O2’s intuitive interface makes it easy for users to upload, visualize, and share geospatial data, even without prior GIS experience.
Wide range of data support – O2 supports a wide range of geospatial data formats, GeoJSON, CSV and GeoTiff (raster and vector data).
Seamless sharing – O2 makes it easy to share geospatial data with others via links or embeds.
Satellite data – O2 offers access to JAXA Earth API and NASA Earth Observations.
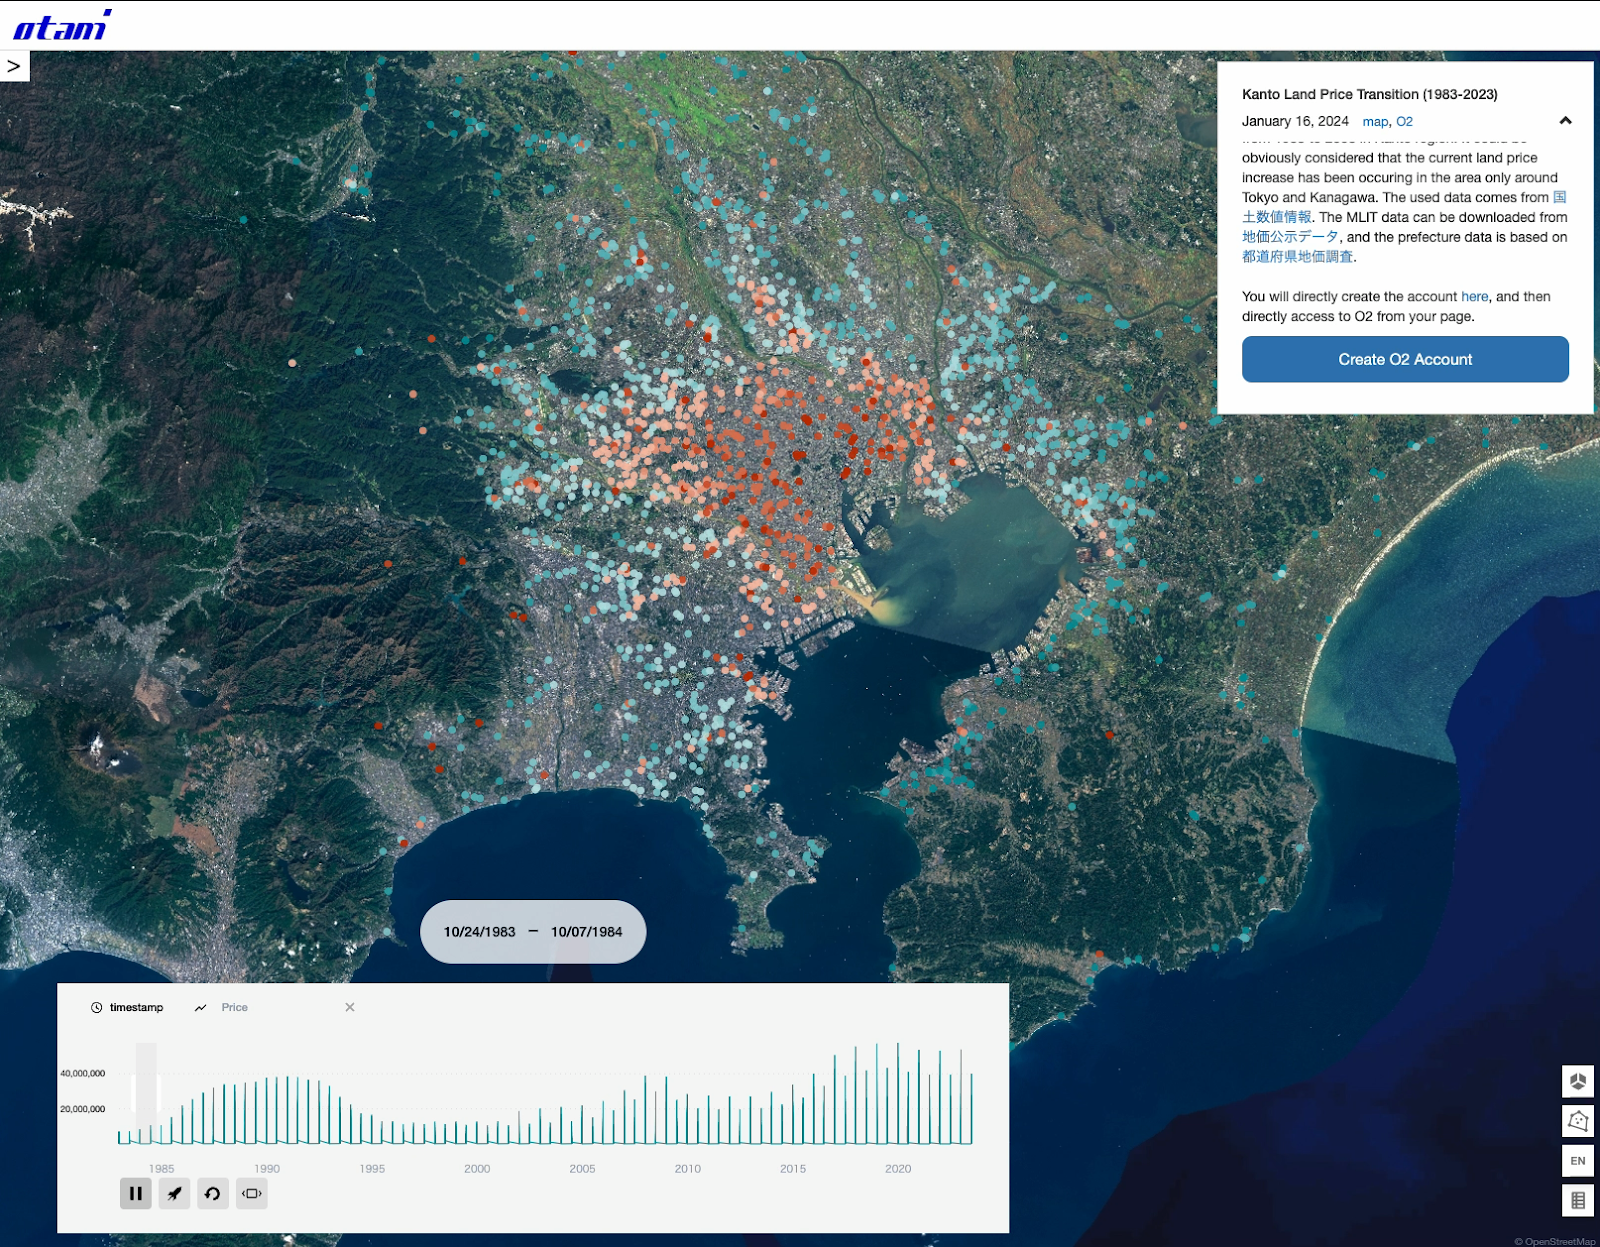
O2 Images
O2 LogoO2 TopSatellite data (JAXA Daytime Daily Land Surface Temperature 22/March/2024 around Yokohama)Japan Land Price Transition from 1983 to 2023
Otani & Co., Inc. is a geospatial data science company that provides a variety of services, including data visualization, analysis, and consulting. The company was founded in 2010 and is headquartered in Yokohama, Japan. The previously developed software “GEEO” that estimates property and land values with statistical algorithms and open data was awarded both The Encouragement Award for Open Data Application by the Minister for Internal Affairs and Communications and The Good Design Award, one of the prestigious awards for design in Japan.
A digital CV of Yuichiro Otani, a founder of Otani & Co., Inc., can be found in the link below:
This map visualizes cloud fraction around Brisbane throughout December 2023. White areas represent high cloud cover (1.00), while blue areas indicate thinner clouds (closer to 0.00). Refer to the legend for the exact color scale.
While some thinner cloud cover appeared intermittently, the month generally experienced significant cloudiness. Data was unavailable on the 2nd, 7th, 12th, 19th, 24th, and 31st. Only 7 days had completely clear skies: December 6th, 8th, 15th, 16th, 23rd, 28th, and 29th.
Focusing on the area closest to Brisbane City (north of the Story Bridge), we see the maximum cloud cover (1.00) occurred on December 1st, 14th, 15th, 17th, 21st, 22nd, 25th, and 30th. The lowest cloud cover (0.01) was recorded on December 11th.
You can create an account directly on O2 to access the data and visualizations.
Manage Cookie Consent
We use technologies like cookies to store and/or access device information. We do this to improve browsing experience and to show personalized ads. Consenting to these technologies will allow us to process data such as browsing behavior or unique IDs on this site. Not consenting or withdrawing consent, may adversely affect certain features and functions.
Functional
Always active
The technical storage or access is strictly necessary for the legitimate purpose of enabling the use of a specific service explicitly requested by the subscriber or user, or for the sole purpose of carrying out the transmission of a communication over an electronic communications network.
Preferences
The technical storage or access is necessary for the legitimate purpose of storing preferences that are not requested by the subscriber or user.
Statistics
The technical storage or access that is used exclusively for statistical purposes.The technical storage or access that is used exclusively for anonymous statistical purposes. Without a subpoena, voluntary compliance on the part of your Internet Service Provider, or additional records from a third party, information stored or retrieved for this purpose alone cannot usually be used to identify you.
Marketing
The technical storage or access is required to create user profiles to send advertising, or to track the user on a website or across several websites for similar marketing purposes.